
SPA Summary
Monitor smart process funnels, conversion, and workload in Bitrix24
-
Pengkadaran
-
Pemasangan83272
-
PembangunAlaio, inc
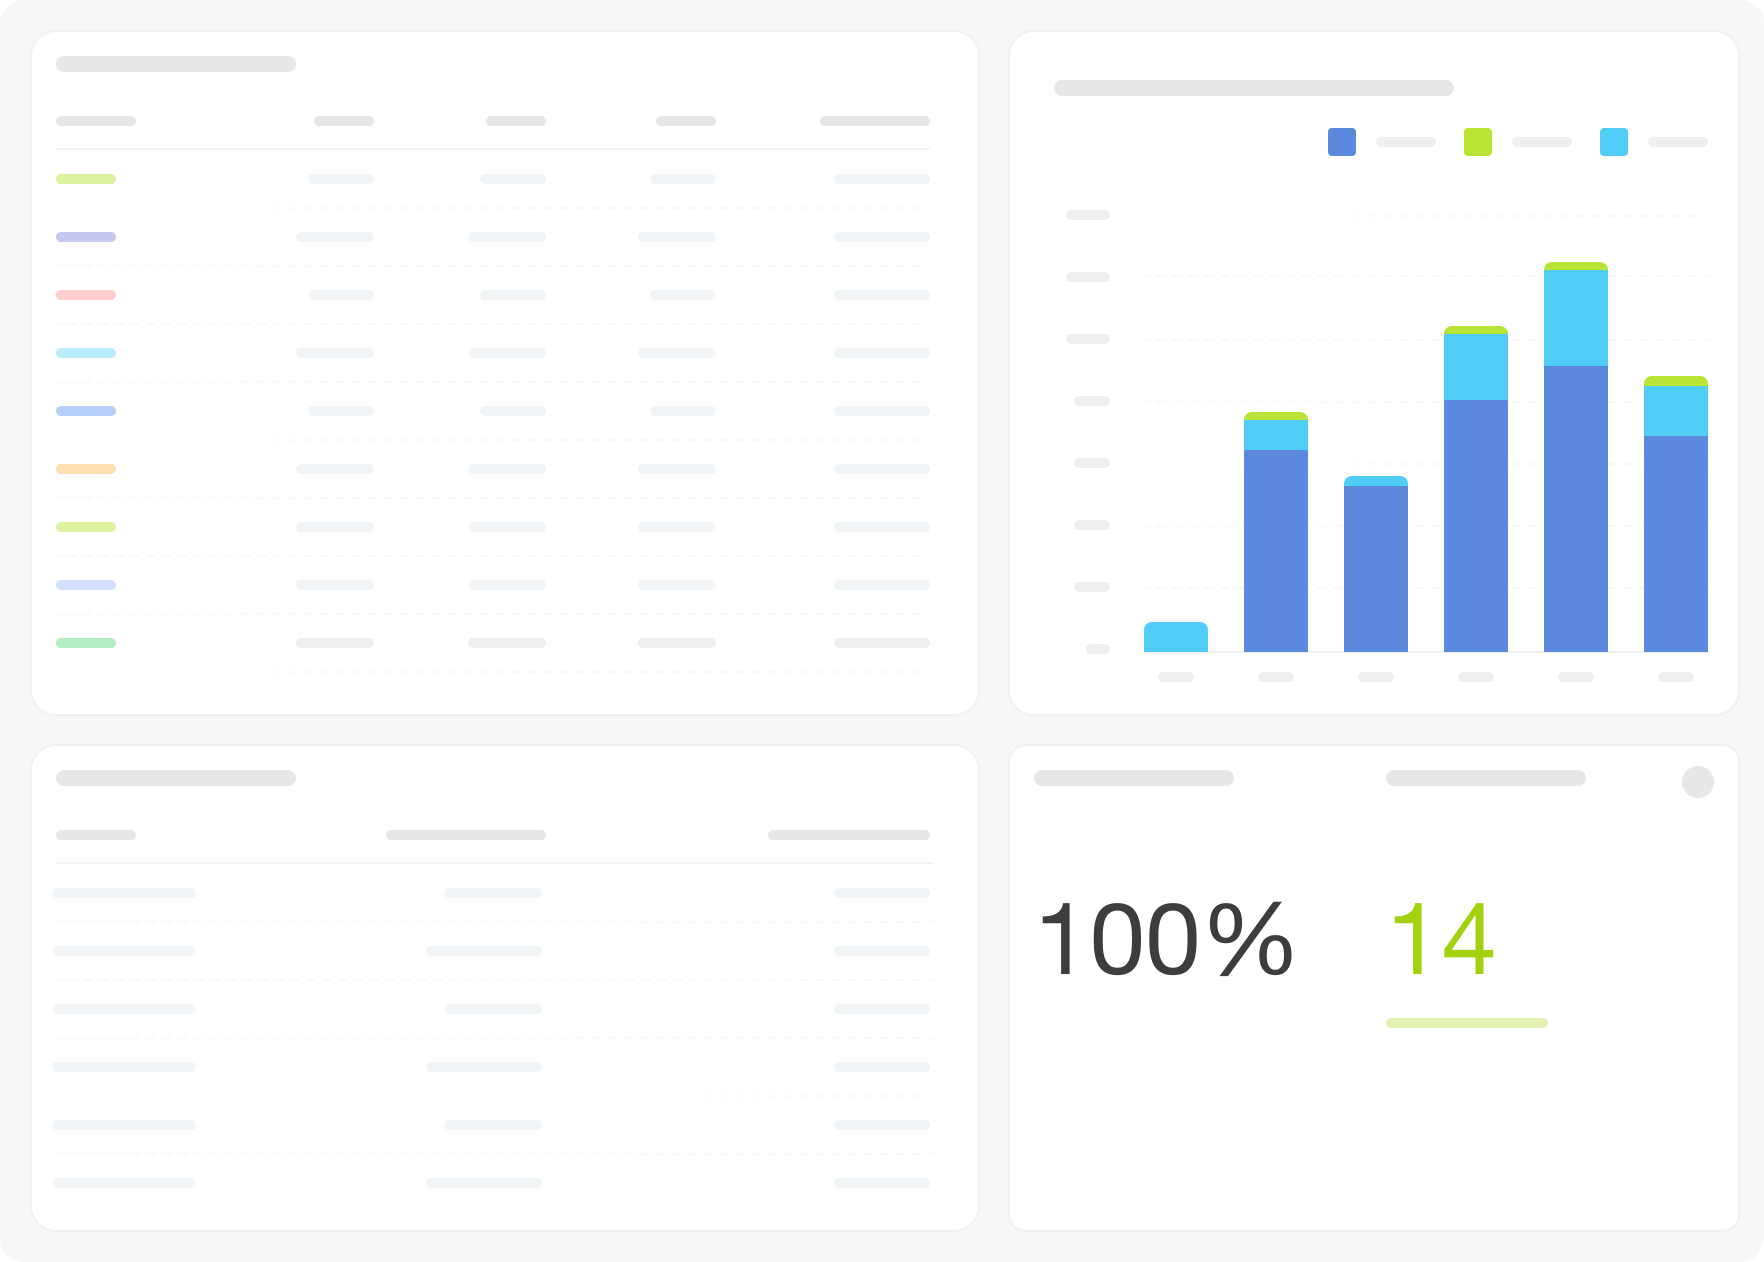
Smart Process Analytics gives managers visibility into how Bitrix24 smart processes are performing — conversion rates by funnel, average close times, stage distribution, and responsible employee workload.
Why businesses use it
Teams using smart processes need the same analytical visibility they have for CRM deals — conversion rates, bottlenecks, and workload by responsible person. Without it, process performance is managed by feel rather than data.
Business value
• Track conversion rates across funnels within a smart process
• Monitor average time to successful close by funnel
• See current stage distribution for records in progress
• Review responsible employee statistics in one table
Common use cases
• Compare conversion rates across smart process funnels
• Identify funnels where records are stalling
• Check which stages have the highest backlog of in-progress records
• Review responsible employee performance for a specific smart process
How it works
The dashboard connects to Bitrix24 smart process data and can be filtered by smart process. Nine visualizations cover funnel conversion rates, average close time trends, close time by funnel, launch volume over time, stage distribution, and responsible employee statistics. Filters: Smart Process, Period, Grouping.
FAQ
We use smart processes instead of classic CRM but have no analytics on how they're actually performing. Where do we start?
Install this dashboard and select your smart process using the filter. You'll immediately see conversion rates by funnel, average close time, and the current distribution of records across stages.
Records seem to be accumulating at certain stages in our smart process but we can't pinpoint where. How do we see that?
The "stages in progress" bar chart shows the current count of records at each stage within the process. The stages with the highest bars are where records are piling up.
We have multiple funnels inside one smart process and suspect they perform very differently. Is there a way to compare them?
Yes — the conversion rates by funnel chart and the average close time by funnel chart both break down performance per funnel, making direct comparison straightforward.
What is needed to connect to Bitrix24?
Access credentials for the Bitrix24 BI connector, configured during app installation.

Sejarah versi
Versi 3
Versi 2


