
Lead generation
Analyze lead quality and conversion by channel from Bitrix24
Free
-
Rating
-
Installations98678
-
DeveloperAlaio, inc
Description
Lead Generation Analytics helps marketing and sales teams evaluate not just how many leads come in, but where qualified leads — those that convert to deals — actually come from. It connects to Bitrix24 CRM lead data with UTM attribution.
Why businesses use it
Volume metrics alone don't tell the full story. Marketing teams need to see which channels, campaigns, and terms produce leads that convert — not just leads that arrive.
Business value
• Evaluate lead conversion by source, campaign, UTM term, and manager
• Separate total lead volume from quality lead counts and conversion rates
• Identify which channels produce results, not just traffic
• Filter out junk leads to see clean conversion data
Common use cases
• Identify which ad sources produce the highest-converting leads
• Compare UTM campaign performance by conversion rate
• Review manager-level lead conversion alongside source attribution
• Use the stage exclusion filter to remove junk from conversion calculations
How it works
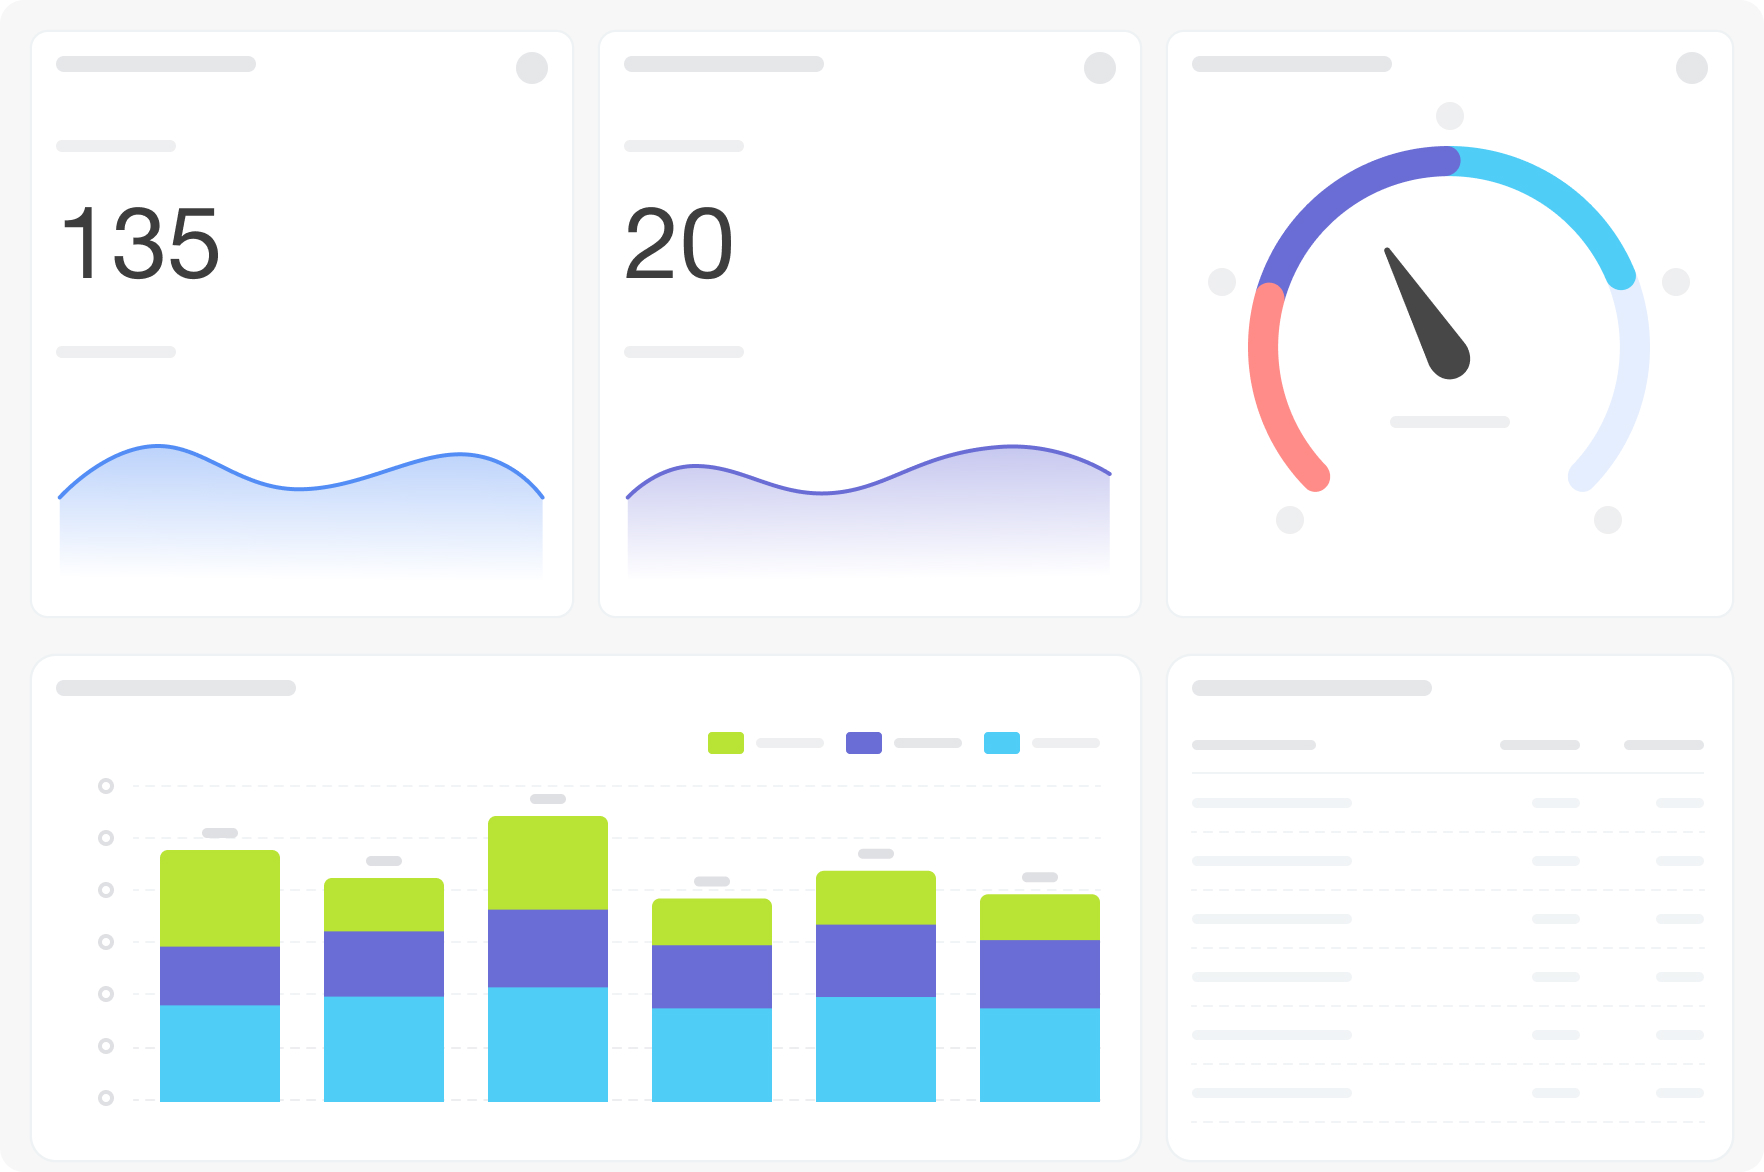
The dashboard connects to the crm_lead table. Eleven visualizations cover KPI cards (total, converted, conversion rate), lead dynamics by semantic status, stage distribution pie, conversion/fail dynamics chart, and five tables breaking down conversion by source, UTM campaign, UTM term, manager, and CRM source. Filters: Period, Grouping, Exclude stage.
FAQ
We're spending money on ads but don't know which channels actually send leads that close. How does this answer that?
The source and campaign tables show conversion rates alongside lead counts — not just volume. You can see which channels produce leads that convert versus channels that inflate the top of the funnel without results.
We have a lot of junk leads that are skewing our conversion numbers. Can we exclude them?
Yes — use the "Exclude stage" filter to remove leads in specific stages (such as junk or test) from all conversion calculations. The numbers will reflect only the leads you consider real.
We can't tell whether our team's conversion rates vary significantly by manager. Is that visible here?
The "leads by responsible" table shows lead count and conversion rate per manager — making performance differences between team members directly comparable.
What is needed to connect to Bitrix24?
Access credentials for the Bitrix24 BI connector, configured during app installation.
Why businesses use it
Volume metrics alone don't tell the full story. Marketing teams need to see which channels, campaigns, and terms produce leads that convert — not just leads that arrive.
Business value
• Evaluate lead conversion by source, campaign, UTM term, and manager
• Separate total lead volume from quality lead counts and conversion rates
• Identify which channels produce results, not just traffic
• Filter out junk leads to see clean conversion data
Common use cases
• Identify which ad sources produce the highest-converting leads
• Compare UTM campaign performance by conversion rate
• Review manager-level lead conversion alongside source attribution
• Use the stage exclusion filter to remove junk from conversion calculations
How it works
The dashboard connects to the crm_lead table. Eleven visualizations cover KPI cards (total, converted, conversion rate), lead dynamics by semantic status, stage distribution pie, conversion/fail dynamics chart, and five tables breaking down conversion by source, UTM campaign, UTM term, manager, and CRM source. Filters: Period, Grouping, Exclude stage.
FAQ
We're spending money on ads but don't know which channels actually send leads that close. How does this answer that?
The source and campaign tables show conversion rates alongside lead counts — not just volume. You can see which channels produce leads that convert versus channels that inflate the top of the funnel without results.
We have a lot of junk leads that are skewing our conversion numbers. Can we exclude them?
Yes — use the "Exclude stage" filter to remove leads in specific stages (such as junk or test) from all conversion calculations. The numbers will reflect only the leads you consider real.
We can't tell whether our team's conversion rates vary significantly by manager. Is that visible here?
The "leads by responsible" table shows lead count and conversion rate per manager — making performance differences between team members directly comparable.
What is needed to connect to Bitrix24?
Access credentials for the Bitrix24 BI connector, configured during app installation.

Version history
Version 4
bug fixes
27.08.2026
Version 3
bug fixes
03.07.2026
Version 2
bug fixes
15.12.2025


