CRM Benchmark Report 2026: Global Data From 1,001 Companies
Key Findings
- Speed: 68% of English-speaking companies answer a new lead within an hour; 8 of 11 other markets fall below that.
- Automation: about 30% of companies automate less than 10% of their CRM workflows.
- Admin load: about 35% of sales teams spend more than half the week on admin.
- Deal velocity: 28% report longer sales cycles; 27% report falling funnel conversion.
- Turkey: the most automated market (50% high adoption), yet the heaviest admin load (56%).
- Japan: the slowest to respond (29% within an hour), yet no lengthening of sales cycles.
- Germany: 43% do not track lead response time; weakest deal velocity among markets.
- Poland: strongest deal velocity among large markets (net +16), with only 19% high automation.
Executive Summary
A buyer's AI agent has just sent your team a detailed request. Whether anyone answers within the hour depends heavily on where you sell: 80% of companies do in France, but only 36% in Germany and 29% in Japan. This CRM benchmark report 2026 draws on a Q3 2026 survey of 1,001 companies using Bitrix24 CRM across 12 markets, and the lead response time statistics it produces point to one bottleneck: manual intake. Where leads go untracked and reps log data by hand, deals are more likely to stall. Automating intake and logging can return up to about 14 hours a week to reps in high-friction teams (a modelled estimate; see Methodology and Limitations).
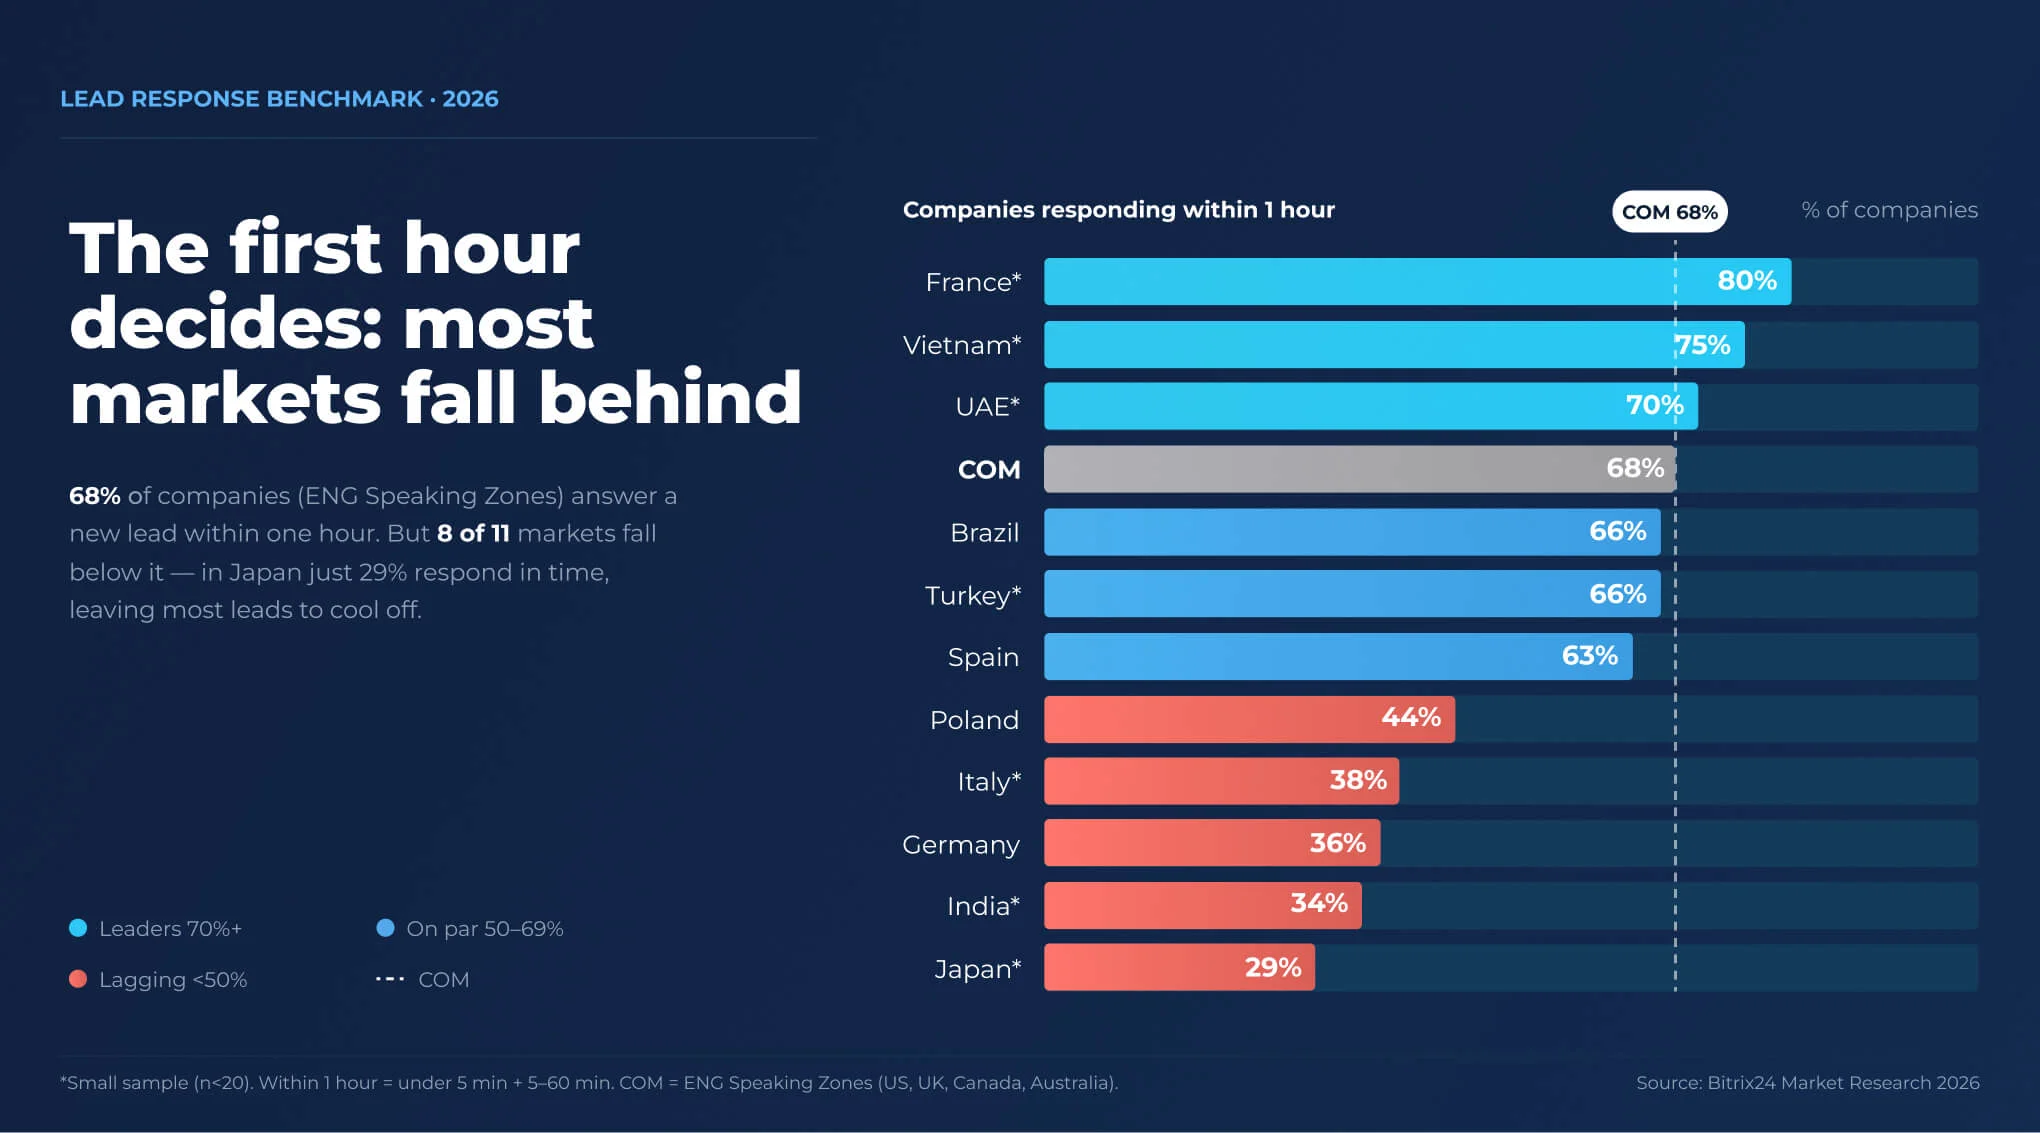
68% of English-speaking companies answer a new lead within one hour; in 8 of 11 other markets the share is lower, down to 29% in Japan.
Modern commercial organizations spend heavily on marketing (MarTech)—purchasing AI-powered content generators, automated copywriting tools, and digital lead-generation systems. However, while marketers work with cutting-edge tech, the lead intake phase—qualification, routing, and initial contact—remains deeply manual. This gap creates severe operational asymmetry: leads generated by artificial intelligence get stuck the moment they hit a manual sales funnel. Companies attract targeted buyer requests using algorithms, and then force sales reps to manually sort incoming applications.
When a business uses a CRM as a "digital notepad" for manual entries rather than an automated workflow engine, leads fall through operational cracks and erode marketing Return on Investment (ROI). The McKinsey State of AI 2026 survey points to a similar gap: 80% of respondents say AI improves their individual productivity, yet only 37% report any impact on their organization's EBIT. Tools alone do not turn into revenue unless the workflows around them change
The Machine vs. Machine Dynamic (The Buyer's Reality in 2026)
Corporate procurement departments and top executives increasingly use AI assistants to evaluate software vendors and submit Requests for Proposals (RFPs). Incoming leads are no longer just people filling out website forms; increasingly, they are buyer AI agents that can send detailed technical specifications to many vendors at once.The rise of AI agents in B2B buying turns first response into a machine-to-machine handshake: the agent evaluates whichever vendor replies within its own polling window. This creates a sharp operational conflict. The buyer's AI agent expects an instant response. In organizations with low CRM automation levels, such an inquiry drops into an unchecked inbox while a rep is away from their desk. A buyer's AI agent is unlikely to wait; it can simply move on to the competitor whose CRM automatically evaluates the request, verifies parameters, and sends a meeting scheduling link within two minutes. In a machine-driven procurement environment, slow manual intake puts deals at serious risk.
The Gartner survey on rep-free B2B buying, which covered 646 B2B buyers, found that 67% prefer a rep-free buying experience and 45% used AI during a recent purchase. As more of the evaluation happens without a sales rep, the speed and quality of a vendor's automated response increasingly shape the first impression.
The Global Picture: Key Macrotrend for 2026
Survey data across all 12 markets points to one main trend: the sales bottleneck increasingly sits not in generating leads but in how effectively commercial teams process them. Taken together, CRM automation statistics across all 12 markets show nearly a third of companies running below the 10% automation threshold.
Across global markets, about 30% of companies operate with low CRM automation. Administrative load remains heavy: about 35% of sales departments spend more than half their workweek on manual log entry. At the same time, more than a third of companies either do not track response times at all or take longer than an hour to answer. Meanwhile, 28% of companies report lengthening sales cycles and 27% report falling funnel conversion. Longer cycles are not only an intake problem: Forrester's State of Business Buying 2026 found that a typical purchase now involves 13 internal stakeholders and nine external influencers, with procurement acting as a decision-maker in 53% of buying cycles.
CRM Benchmark 2026: Lead Response Time, Sales Cycle and Automation by Country
Survey of 1,001 companies using Bitrix24 CRM in Q3 2026: lead response time, end-to-end funnel conversion trend, sales cycle trend, rep admin workload and CRM workflow automation depth, by market. Responses are anonymized and reported in aggregate.
| Response | English-speaking (COM) |
India | Germany | Brazil | Spain | France | Turkey | Poland | Vietnam | Japan | UAE | Italy |
|---|---|---|---|---|---|---|---|---|---|---|---|---|
| 1. Speed of Lead Response Time | ||||||||||||
| < 5 Minutes | 40% | 17% | 18% | 26% | 23% | 40% | 22% | 19% | 75% | 29% | 57% | 25% |
| 5 to 60 Minutes | 28% | 17% | 18% | 40% | 40% | 40% | 44% | 25% | 0% | 0% | 13% | 13% |
| > 60 Minutes | 9% | 50% | 21% | 17% | 9% | 0% | 11% | 12% | 0% | 14% | 29% | 19% |
| Untracked | 23% | 16% | 43% | 17% | 28% | 20% | 22% | 44% | 25% | 57% | 0% | 43% |
| 2. End-to-End Funnel Conversion Rate | ||||||||||||
| Expanding Higher percentage of leads converting to revenue | 28% | 0% | 11% | 25% | 29% | 40% | 22% | 26% | 0% | 29% | 14% | 25% |
| Stable Conversion rates plateaued at historical baselines | 52% | 33% | 57% | 48% | 41% | 40% | 44% | 53% | 25% | 71% | 57% | 44% |
| Contracting Increased drop-off across funnel milestones | 20% | 67% | 32% | 27% | 30% | 20% | 34% | 21% | 75% | 0% | 29% | 31% |
| 3. Average Sales Cycle Length (Deal Velocity) | ||||||||||||
| Compressing Deals closing faster than previous quarters | 35% | 17% | 11% | 17% | 27% | 20% | 28% | 30% | 0% | 29% | 0% | 25% |
| Stagnant No measurable shift in time-to-close | 42% | 33% | 46% | 50% | 46% | 60% | 39% | 56% | 50% | 71% | 57% | 31% |
| Elongating Deals stalling, prolonging procurement | 23% | 50% | 43% | 33% | 27% | 20% | 33% | 14% | 50% | 0% | 43% | 44% |
| 4. Rep Workload & Manual Data Burden | ||||||||||||
| High Friction >50% of rep capacity spent on data entry/admin | 39% | 0% | 21% | 31% | 39% | 40% | 56% | 33% | 50% | 29% | 0% | 25% |
| Optimized Balanced split between administrative tasks and selling | 43% | 33% | 43% | 50% | 47% | 40% | 28% | 33% | 50% | 71% | 71% | 19% |
| Autonomous CRM automation minimizes manual pipeline logging | 18% | 67% | 36% | 19% | 14% | 20% | 16% | 7% | 0% | 0% | 29% | 56% |
| Not measured Poland only | — | — | — | — | — | — | — | 27% | — | — | — | — |
| 5. Core CRM Workflow Automation Depth | ||||||||||||
| High Adoption >50% of routine workflows, scoring, and routing automated | 37% | 17% | 11% | 26% | 22% | 20% | 50% | 19% | 0% | 14% | 0% | 31% |
| Mid Adoption 10% to 49% basic trigger automation | 39% | 33% | 36% | 47% | 48% | 40% | 33% | 43% | 50% | 14% | 43% | 19% |
| Low Adoption <10% or strictly manual operations | 24% | 50% | 53% | 27% | 30% | 40% | 17% | 38% | 50% | 72% | 57% | 50% |
All values are the share of companies in each market. COM = US, UK, Canada, Australia. Percentages are rounded.
Source: Bitrix24 in-platform survey of 1,001 companies using Bitrix24 CRM, July 21–28, 2026. Published by the Bitrix24 Research Team.The Great CRM Disconnect — Q3 2026 CRM BenchmarkBitrix24

CRM Automation by Country: Most Teams Stop at the Basics
Only in English-speaking markets do more than a third of companies (37%) automate most of their CRM workflows; elsewhere, most teams stop at simple triggers.
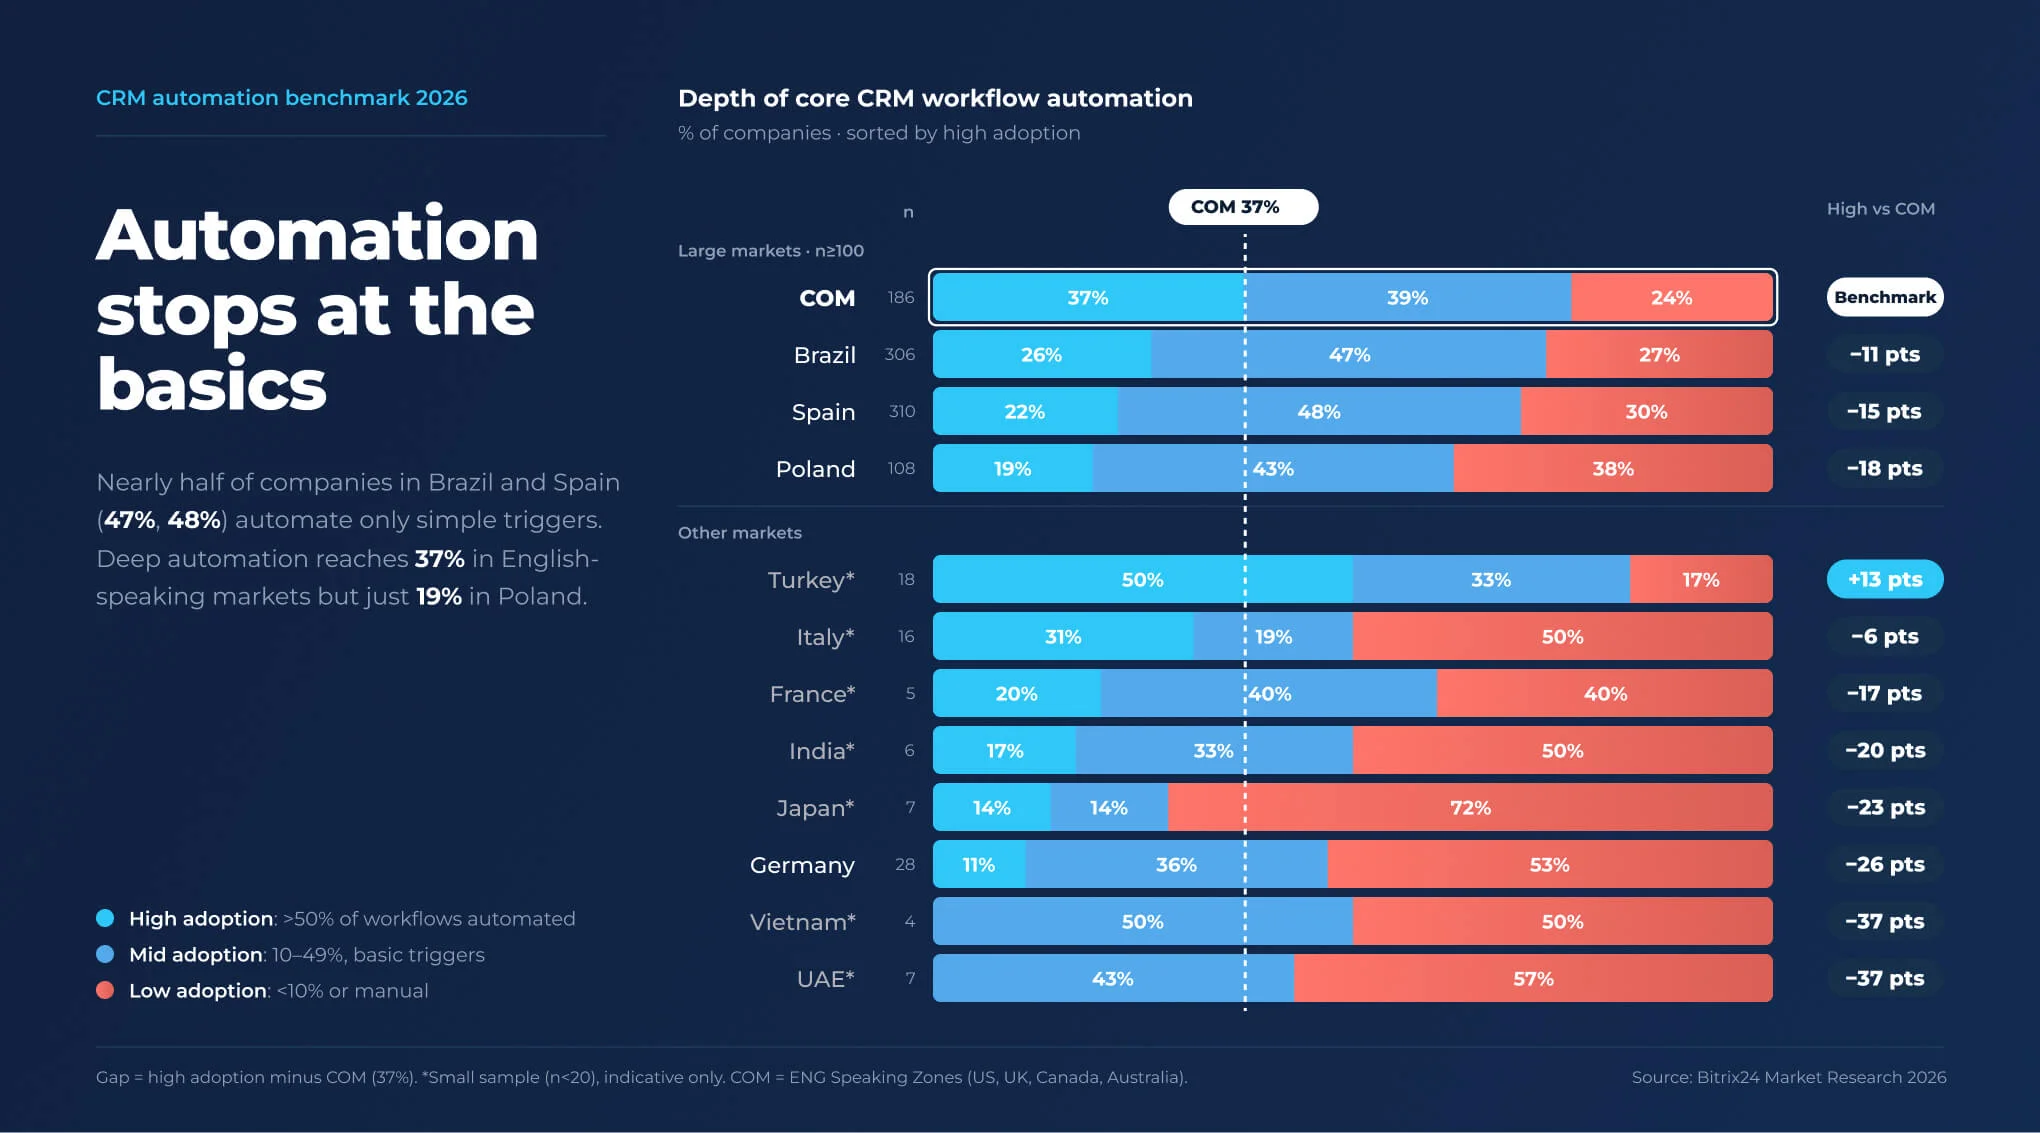
37% of English-speaking companies automate more than half of routine workflows; Japan has the largest low-adoption share at 72%.
Macro-Region Analysis
1. English-Speaking Markets (COM: US, UK, Canada, Australia): Strong Tools, Uneven Habits
- High administrative burden: 39% of companies suffer from severe operational friction, with reps spending over half their time on manual logging.
- Untracked response speed: 23% of organizations do not measure lead response times.
- Contracting pipelines: 20% report a direct contraction in funnel conversion rates.
English-speaking markets have the most mature CRM automation among the large markets in the study: 37% of companies automate more than half of their routine workflows, and only 24% remain at a low adoption level. Yet the gains are unevenly spread. 39% of companies still lose more than half of rep capacity to manual logging, and 23% do not measure lead response times at all. The tools are largely in place; the gap lies in how consistently teams use them. Where trigger automation is set up, reps stop typing records, copying phone numbers and updating deal stages one by one. Where it is not, the CRM turns into a static database while people do work that background scripts could handle automatically.
2. Germany (DE): The Unwatched Front Door
- Untracked response speed: 43% of companies do not monitor lead response time.
- Longer sales cycles: 43% of companies report increased deal closure timeframes.
- Low automation depth: 53% operate at a low level of CRM automation.
Germany shows a clear gap at the very first step of the sales process: 43% of companies do not monitor lead response times, and 53% run their CRM at a low level of automation. Measured against the other markets, German pipelines show the weakest deal velocity among the larger markets. When the front gate is unmonitored, incoming leads wait in untracked queues. Even a well-designed sales process loses value if requests get stuck at the threshold: 43% of German companies report longer sales cycles, against 11% that see deals closing faster.
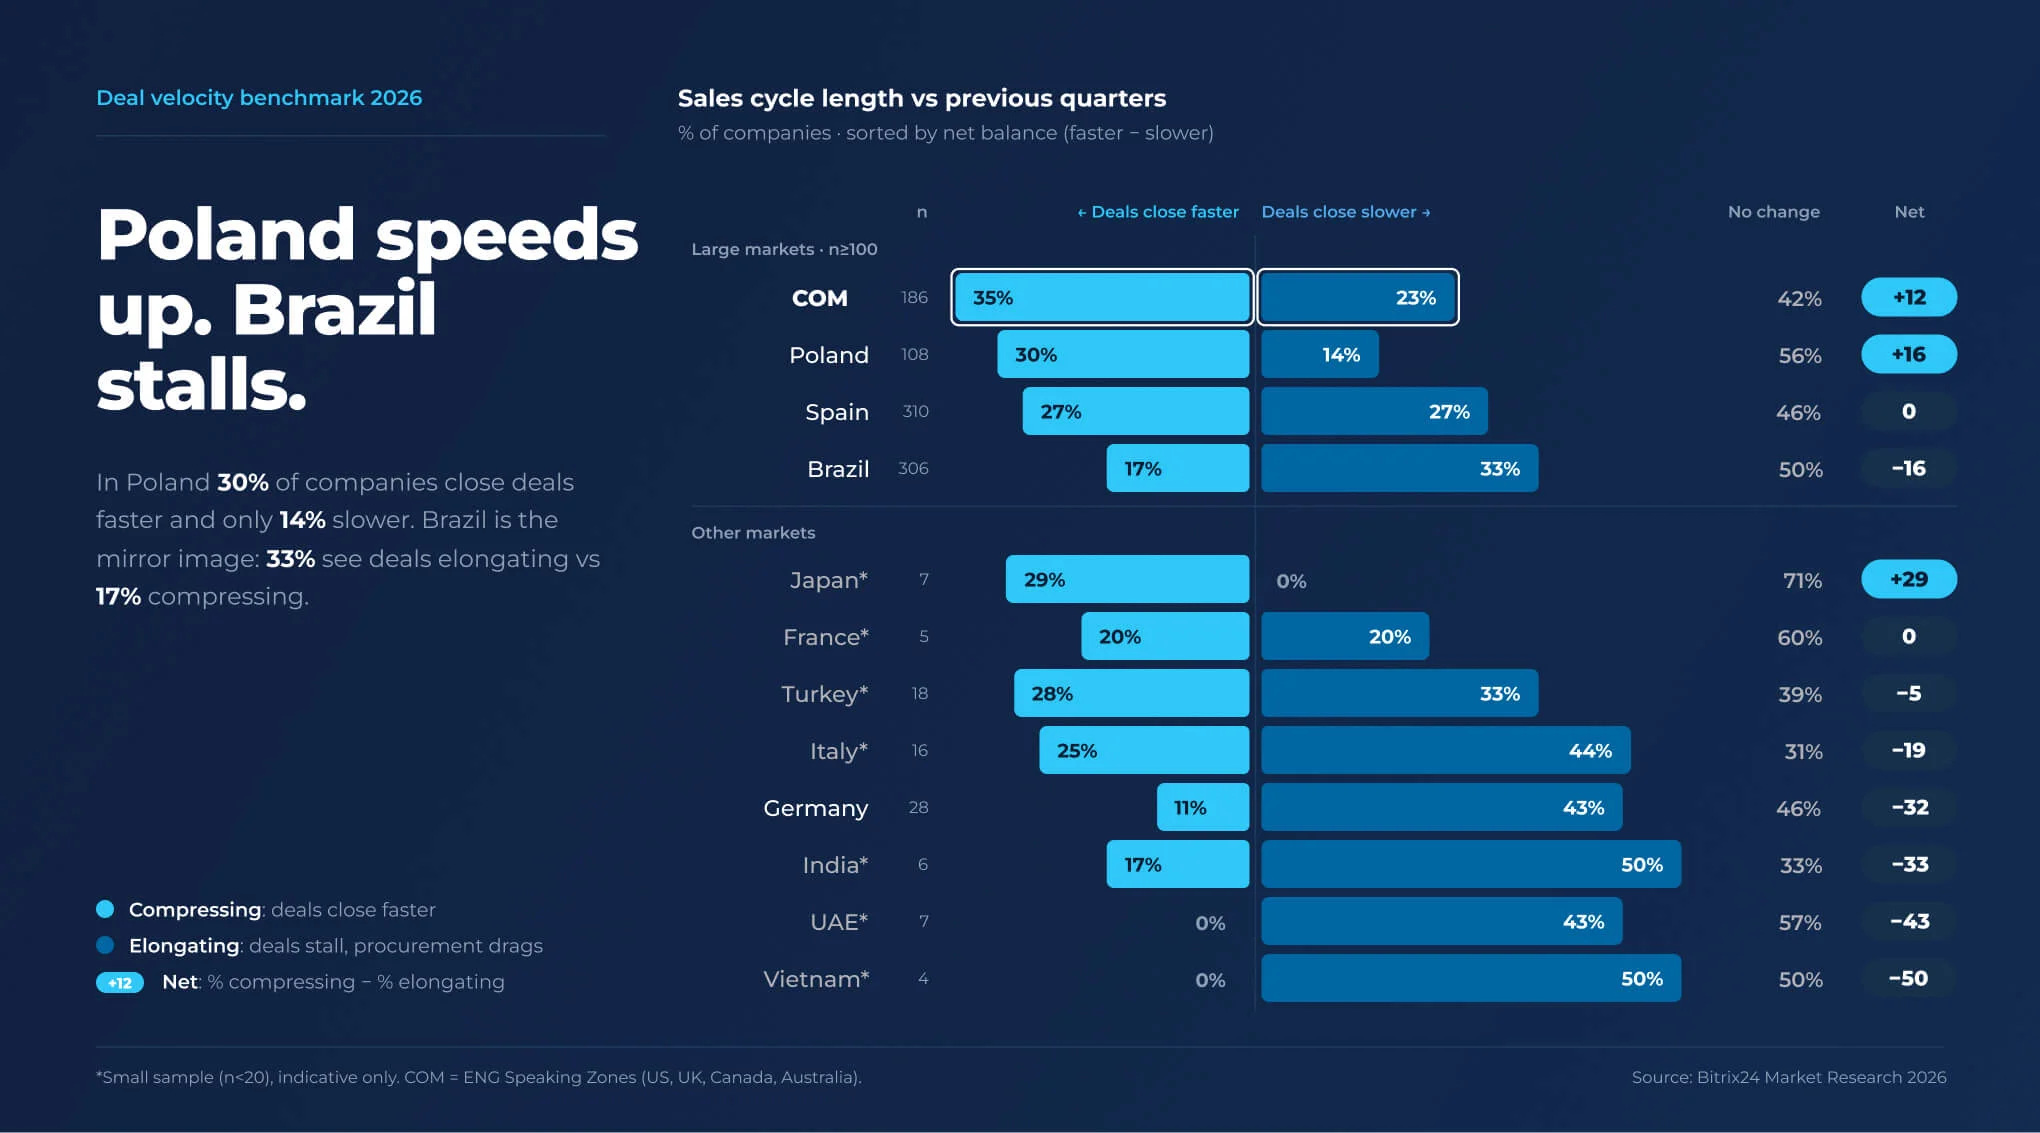
Poland shows the strongest deal velocity among large markets (net +16); Brazil the weakest (net −16).
3. Japan (JP): The Silent Blind Spot
- Untracked response speed: 57% of companies in Japan do not measure lead response times, the highest share in the study.
- Actual adoption: 72% operate at a basic manual level (low adoption), and none report a fully autonomous CRM workflow.
- Stable, not growing: 71% report no change in sales cycle length and 71% see stable funnel conversion, while 29% say deals are closing faster.
Japan presents the study's most counterintuitive picture. Most companies run their CRM with little automation and leave response times unmeasured, yet funnels and deal cycles are holding steady rather than deteriorating. The likely explanation is discipline: teams compensate for missing automation with careful manual follow-up and close attention to each client, in line with the service tradition of Omotenashi (anticipating customer needs). But stability built on manual effort is fragile. When 57% of companies cannot see how quickly leads are answered, they cannot spot the moment response quality starts to slip, and buyer AI agents that expect instant replies will not wait for a careful human. Automating lead intake and response tracking lets Japanese teams keep their service standard while scaling it beyond what manual attention can sustain.
4. India (IN): The Perception Gap
- Funnel and speed impact: 50% of companies note longer sales cycles, and 67% suffer from contracting conversion rates.
- Perception gap: 67% of teams claim an autonomous workflow structure, while only 17% have reached high CRM automation adoption.
- Low adoption ceiling: 50% of businesses operate at a low level of automation (under 10% or fully manual).
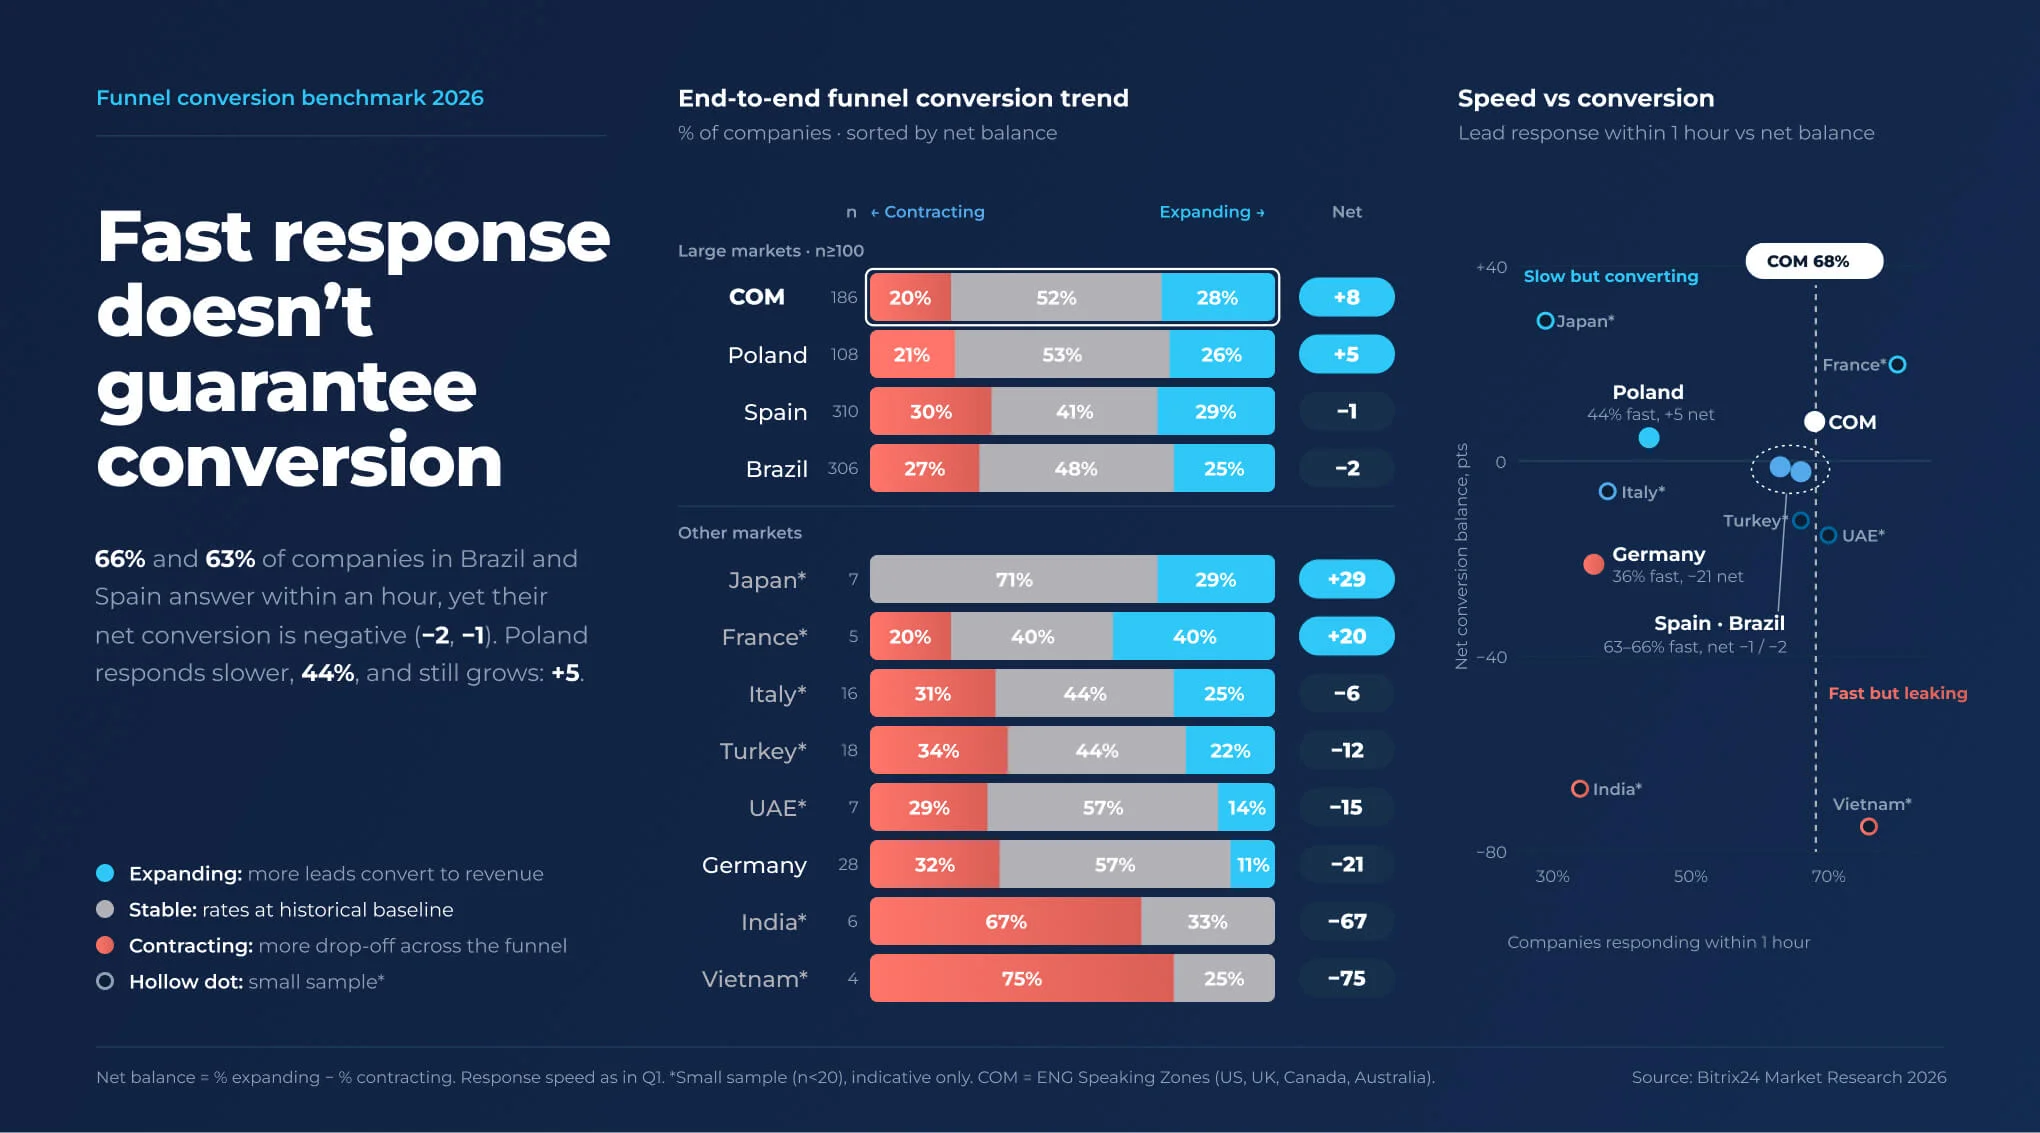
Fast response does not guarantee conversion: 29% of Japanese companies answer within an hour, yet Japan has the best net conversion (+29).
5. France (FR): Where Compliance Meets Admin Load
- Administrative routine: 40% of companies face heavy operational friction (over 50% of time spent on logging).
- Automation imbalance: 20% of companies have deployed advanced automation, while 40% sit at a medium adoption level.
- Cycle drag: 20% report longer sales cycles, and 20% report contracting funnels.
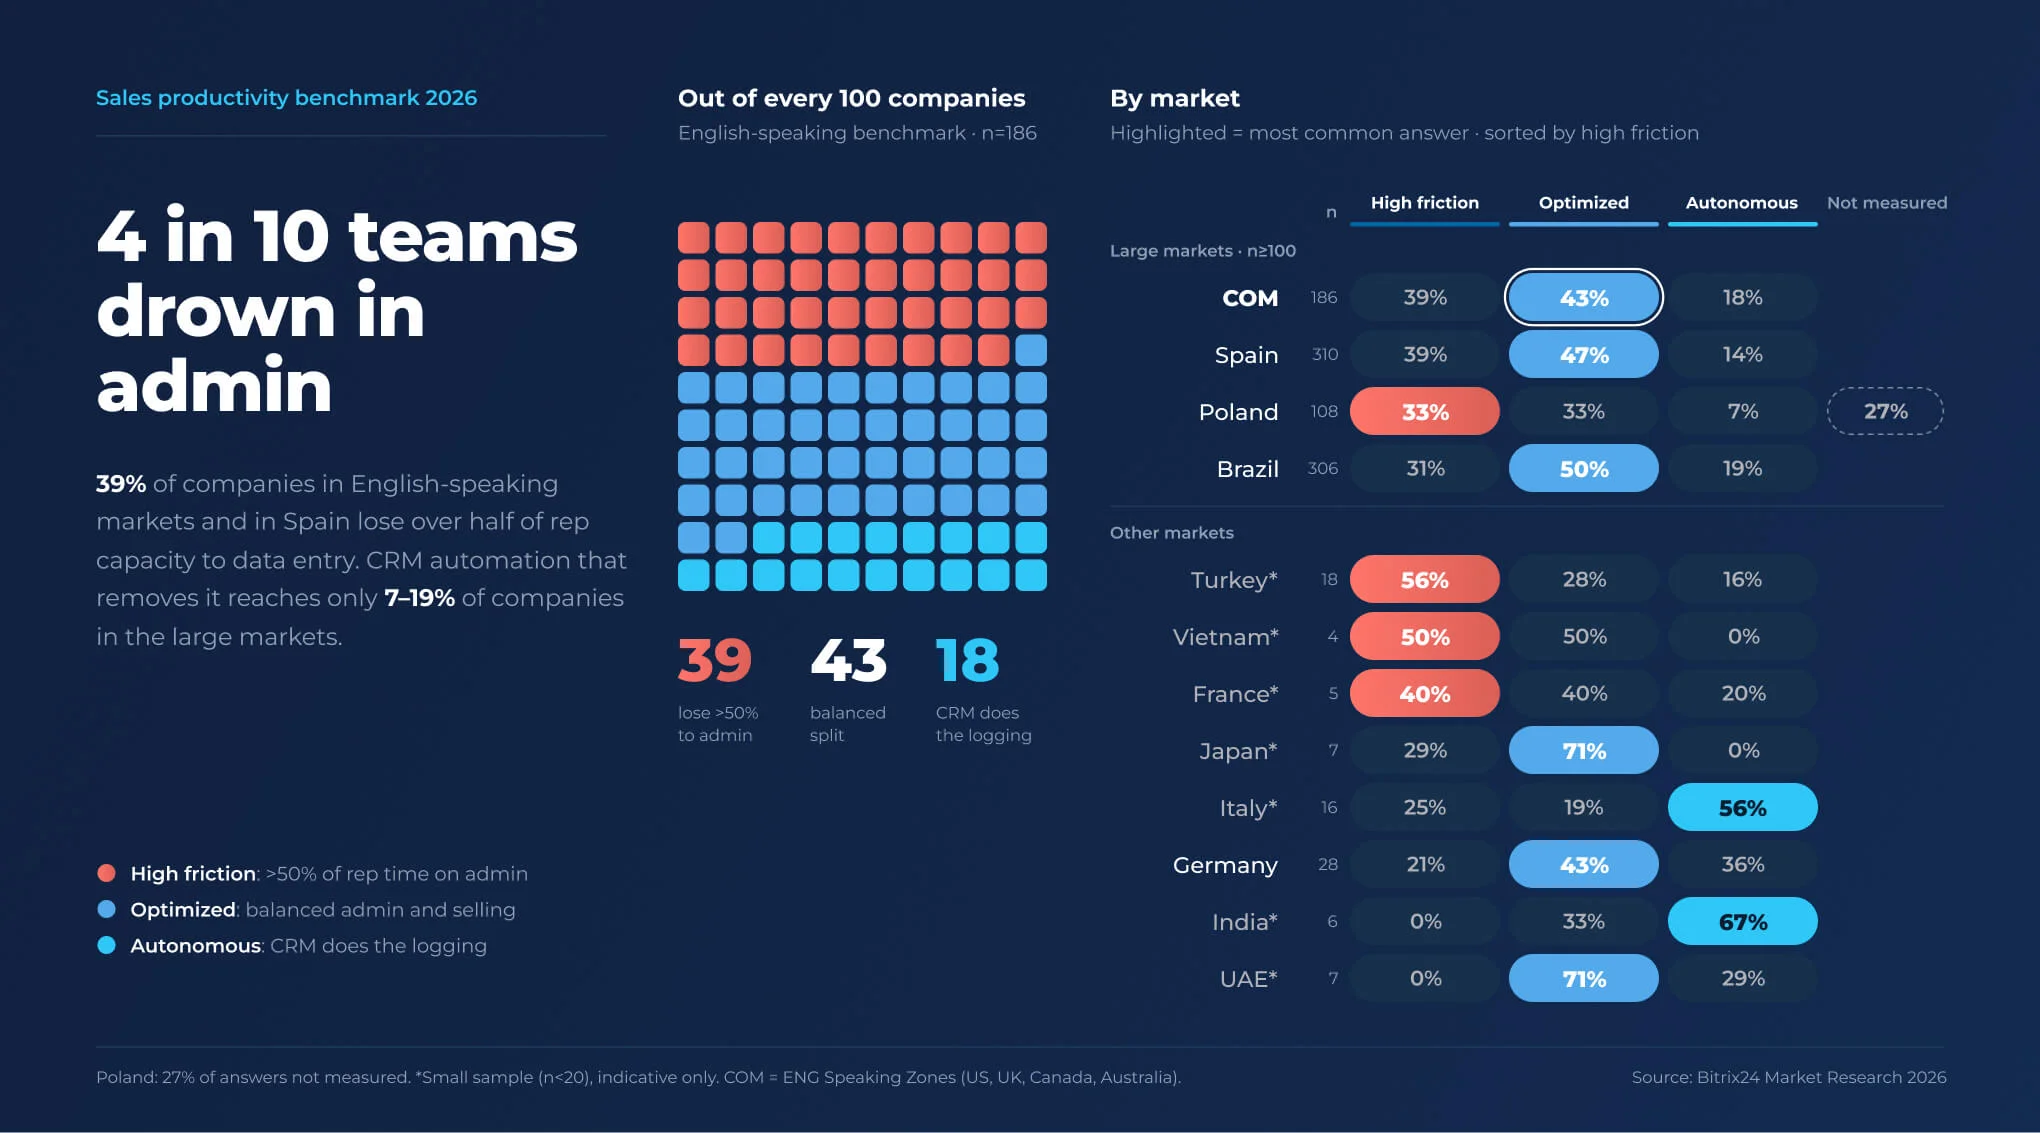
39% of companies in English-speaking markets and Spain lose more than half of rep capacity to admin; Turkey is highest at 56%.
6. Italy (IT): A Market Split in Two
- Untracked lead SLA: 43% of companies do not measure response times to incoming inquiries.
- Low adoption: 50% of companies operate at a low level of CRM automation.
- Slowing pipelines: 44% report longer sales cycles.
Italy sits at the weak end of our sales cycle length benchmarks: 44% of companies report longer cycles, and 43% leave response times untracked entirely. Italy is a split market. On one side, 31% of companies run highly automated CRM workflows, one of the highest shares in the study, and 56% say their CRM handles most of the logging. On the other, half the market still operates at a low adoption level. For the companies left behind, prospective clients cool down while waiting, and ready-to-buy digital buyers move on to competitors.
7. Spain (ES) and Brazil (BR): Fast Starts, Slow Finishes
- Brazil (BR): 27% of companies have low CRM automation, yet 26% of companies manage to respond to new leads in under 5 minutes.
- Spain (ES): 30% of companies run at a low level of CRM automation, and 28% do not track lead response times.
- Longer cycles: 27% of Spanish companies report longer sales cycles.
A comparison between Brazil and Spain shows that a fast first reply is not the same as a fast pipeline. Brazilian teams are quick at the front door: 66% of companies answer a new lead within an hour, and 26% within five minutes, even though only 26% run highly automated CRM workflows. But that speed fades further down the funnel: 33% of Brazilian companies report longer sales cycles, against 17% that see deals closing faster. Speed achieved through manual effort is hard to sustain across every stage of a deal. Spanish teams face a different gap: 28% do not track lead response times at all, so they cannot tell when leads start to cool. In both markets, the next step is the same: hand routine intake and follow-up to automated CRM triggers, so reps don't have to act as "human alarm clocks."
8. Poland (PL): Growing Without a Dashboard
- Admin load unmeasured: 27% of Polish companies do not measure rep admin workload.
- Speed blind spots: 44% of companies completely leave response times untracked.
- Automation ceiling: 38% of organizations remain stuck at low adoption levels.
Poland posts the strongest deal velocity among the large markets: 30% of companies close deals faster than in previous quarters, and only 14% report longer cycles. This is likely driven by direct, relationship-led selling rather than by automation: only 19% of Polish companies run highly automated CRM workflows. The risk is visibility. 44% do not track lead response times, and 27% do not measure how much rep time goes to admin work. Teams that grow without these measurements cannot see where capacity runs out until it already has. Automating intake and tracking now lets Polish teams keep their momentum as volumes grow.
9. Turkey (TR): Automated, Yet Overloaded
- Deepest automation: 50% of companies automate more than half of their routine workflows, the highest share in the study.
- Heaviest admin load: 56% still lose more than half of rep capacity to data entry and admin, also the highest share in the study.
- Mixed results: 33% report longer sales cycles against 28% that see deals closing faster, and a third report contracting funnels.
Turkey is the study's most counterintuitive result, and a useful warning. Turkish companies have automated more of their workflows than any other market, yet their reps carry the heaviest admin load. Automation does not remove manual work on its own if it is layered on top of existing processes rather than replacing them: reps may still re-enter data, double-check automated records, or work around rigid workflows. The lesson for every market is that the goal is not more automation, but less manual work, and measuring rep admin time before and after each rollout is the only way to know which one you are getting.
10. United Arab Emirates (AE): Fast Front Door, Slow Pipeline
- Response discipline: Every UAE company in the study tracks lead response times (0% untracked), and 57% answer new leads in under five minutes.
- Balanced workloads: 0% report high admin friction; 71% keep a balanced split between admin and selling, and 29% say their CRM handles the logging.
- Shallow automation: 57% still run on low CRM automation, and none report high adoption.
- Pipeline drag: 43% see sales cycles getting longer and 29% report contracting funnels; no company reports deals closing faster.
The UAE gets the first step right better than almost any market in the study. Teams measure every lead, respond quickly, and keep reps out of heavy admin work. But speed at the front door does not carry through the rest of the pipeline. With most companies still running shallow, largely manual CRM processes, deals slow down after the first contact: qualification, follow-up and proposal stages depend on individual reps rather than on automated workflows. The UAE shows that a fast first reply is necessary but not sufficient. The next gain comes from automating what happens after the reply (routing, qualification and timely follow-up) so that early momentum turns into closed deals. Which raises the real question: what is speed actually worth?
Bitrix24 Perspective: Recommendations and Modelled Estimates
The survey findings end here. The sections below set out Bitrix24's interpretation and recommendations, and include modelled estimates (the 14-hour time saving, the lead leakage formula and the calculator). They build on the survey data and on stated assumptions, but they are not survey measurements.The takeaway for commercial leadership in Q3 2026 is simple: market share is won not by expanding sales headcounts or endlessly buying new software, but by automating basic workflows in the CRM in a way that actually removes manual work. Automating lead qualification, routing, and status updates removes friction at intake, frees up rep resources, and reduces revenue loss.
Five Steps to Fix CRM Intake
- Measure the front door: track response time for every inbound lead; about 26% of companies in the study do not track it at all.
- Route automatically: assign new leads to the first available rep and trigger an alert when a lead goes unanswered for a set time.
- Filter before the funnel: use mandatory input rules, automatic duplicate checks and bot filtering so reps only see real leads.
- Remove manual steps, don't add layers: measure rep admin time before and after each rollout; Turkey shows that automation layered on top of manual work does not reduce the load.
- Reinvest the time: decide in advance where reclaimed hours go; Gartner finds that 72% of sales organizations fail to reinvest time saved by AI.
Shift in Focus: Time-to-Value vs. Hollow Speed
Rushing just to fit into a 5-minute contact window often hurts business. When reps drop everything just to send a template email, the buyer gets zero value. Real operational efficiency depends on Time-to-Value (TTV)—how quickly a buyer gets a meaningful answer to their specific question. A Gartner survey on the sales productivity paradox found that AI tools save sellers an average of 4.8 hours a week, yet 72% of sales organizations fail to reinvest that time in high-value activities. Saved time and fast contact only pay off when they turn into meaningful buyer interactions. Our 14-hour estimate is higher than Gartner's because it models full workflow automation (intake, routing and logging), not individual AI tools.
The Data Sieve Collapse and Unchecked Bots
Process automation without strict data filtering rules creates chaos. Unprotected website forms and marketing bots flood CRM systems with duplicates, fake contacts, and junk AI leads. Instead of selling, reps spend hours deleting duplicates and fixing messy records. CRMs require mandatory input rules, automatic background duplicate searches, and bot filtering before leads ever enter the active funnel.
How to Stop Rep Resistance and System Sabotage
Top-down automation rollouts that ignore sales rep input usually trigger pushback. When management forces rigid CRM steps that require extra clicks, reps start fighting the system. They keep real deal notes in personal notebooks, chat with clients in private messengers, and hide contact details. Involving reps in CRM design ensures the system relieves them of routine tasks rather than multiplying bureaucracy.
Protecting Reps and Refocusing on Sales
CRM automation must not be used for micromanagement; it should protect salespeople from administrative drudgery. Systems must clean data before a rep ever opens a card—automatically scoring leads, filtering out spam bots, and loading background intel.
When a rep is in an important meeting with a major client, automated triggers protect their funnel. Background scripts send introductory materials, keep response times within two minutes, or reroute requests to available colleagues. Automating routine tasks lets salespeople focus on what matters most: talking to clients and closing deals. That human role is not going away: the Gartner survey on how B2B buyers validate AI-generated insights found that 69% of buyers prefer to check AI-generated insights with a sales rep.
The Financial Cost of Lead Leakage at Intake
To estimate the damage from uncontrolled intake, look at how much revenue the leads at risk represent:
Revenue at risk per year = Monthly inbound leads × 12 × Lead leakage rate × Win rate × Average deal value
Example: 1,500 × 12 × 26% × 25% × $250 = $292,500 in annual revenue at risk
The 26% leakage rate is the study's all-market benchmark: the share of companies that do not track lead response times at all. It is an illustrative proxy, not a measured share of lost leads. With the broader 38% benchmark (companies that either do not track response times or take longer than an hour to reply), the same example rises to $427,500 a year. Setting up automatic triggers in CRMs reduces lead leakage, can give reps in high-friction teams back up to 14 hours of selling time a week, and protects marketing investments.
TRY IT YOURSELF
Interactive Tool: Calculate Your Lead Leakage Drain
The formula above illustrates how quickly hidden friction turns into lost revenue. Use our interactive benchmarking calculator below to run the diagnostic metrics for your own commercial organization.
How to use this tool:
- Sales reps: Enter the number of reps on your team.
- Avg. monthly rep salary: Used to put a value on the selling time you could reclaim.
- Monthly inbound leads: Enter the number of new customer inquiries your team receives each month.
- Average deal value: Enter the typical value of a closed deal.
- Win rate on recovered leads: Enter the share of recovered leads you would expect to close (25% by default).
- Manual admin hours: Enter the hours each rep spends on data entry and admin per week; high-friction teams spend 20 or more.
- Lead leakage benchmark: Choose the benchmark from the study closest to your market: 23% (English-speaking markets), 26% (all markets), 38% (untracked or slower than one hour) or 43% (Germany).
The calculator estimates the selling time you could reclaim each year, the number of inbound leads at risk, and the annual revenue those leads represent. Results are illustrative and based on the benchmark ranges in this study.
Stop letting manual intake stall your sales pipeline and start automating your lead workflows. Access the complete data, global benchmarks, and regional insights in our Q3 2026 CRM Benchmark report: The Great CRM Disconnect: CRM Benchmark Report 2026 on Why Manual Intake Holds Sales Back
Methodology and Limitations
Survey design. The CRM Benchmark Report 2026 is based on an in-platform survey of companies using Bitrix24 CRM, fielded from July 21 to July 28, 2026 (Q3 2026). The survey was open to Bitrix24 accounts active for more than three months. Respondents were portal administrators, business owners and CRM managers at organizations of all sizes, from sole proprietors to enterprises, including non-profit organizations. Each respondent answered five multiple-choice questions about their sales operations.
Sample. 1,001 companies across 12 markets.
Weighting and rounding. Market-level figures are unweighted shares of respondents in each market. Global figures pool all 1,001 responses and are therefore weighted by sample size; Spain and Brazil account for 62% of responses. Percentages are rounded to whole numbers and may not add up to 100%. Responses are anonymized and reported in aggregate.
How we estimate the 14 hours. Respondents in the “High Friction” category report that more than half of rep capacity goes to data entry and admin, at least 20 hours of a 40-hour week. For teams where CRM automation handles logging (“Autonomous”), we assume admin falls to roughly 15% of the week, or about 6 hours. The difference, about 14 hours per rep per week, is a modelled estimate, not a directly measured figure.