How to Use Gantt Charts for Effective Project Planning


Most teams treat Gantt charts as something to present, not something to work from. They look organized, they satisfy stakeholders, and then they sit untouched while the project drifts.
What follows covers the full picture: when Gantt charts work, when they don't, how to build one that survives contact with reality, and the mistakes that make most of them useless by week two.
TL;DR
- A Gantt chart is most useful before execution begins, when you're still deciding order, timing, and dependencies. Used correctly, it becomes a decision-making tool rather than a static timeline.
- The teams that get the most from Gantt charts pair them with Kanban boards for daily flow, workload views for capacity planning, and task-level communication so the plan stays connected to real work.
- Research shows that organizations with mature project management practices achieve nearly three times the project success rate of underperformers.
- Match the tool to the decision you're making, not to every project by default, and Gantt charts become significantly more valuable.
What is a Gantt chart?
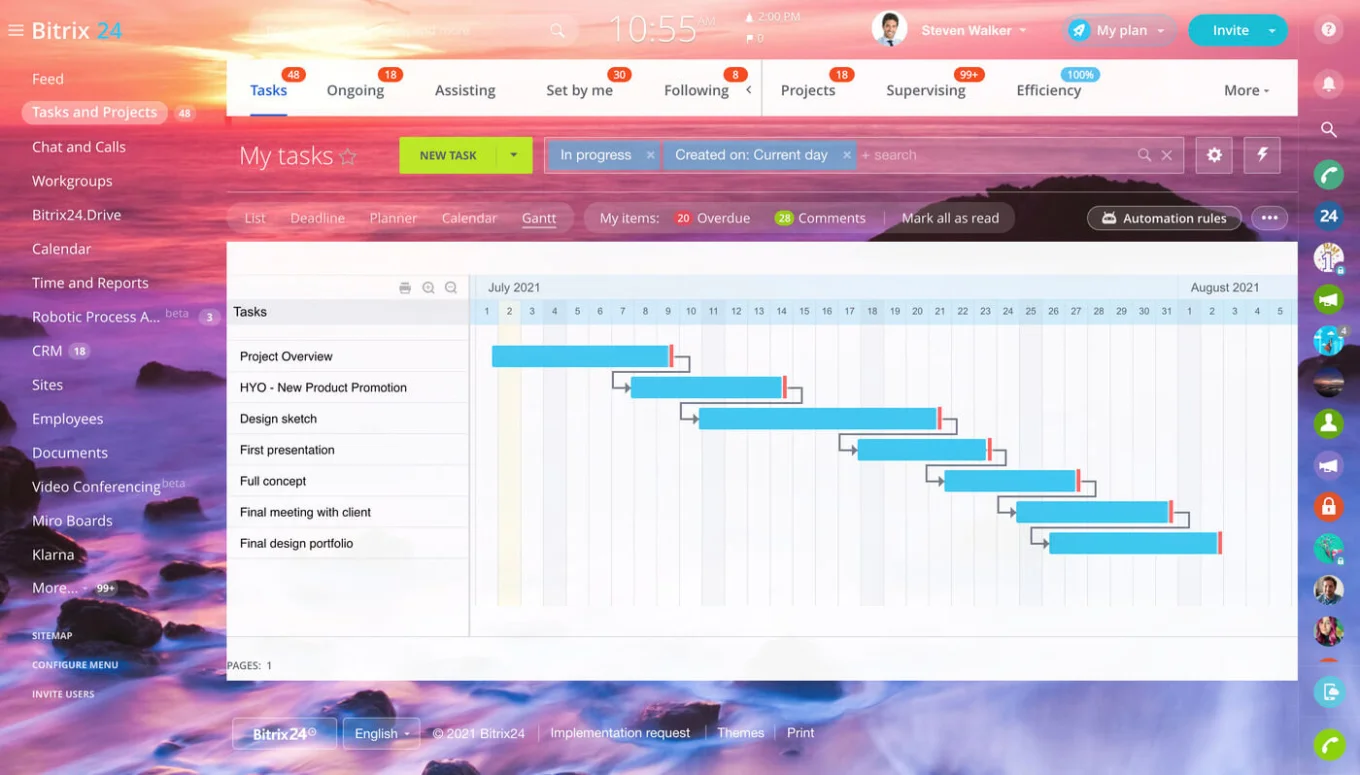
A Gantt chart is a project planning tool that shows tasks on a timeline. Each task appears as a bar, with its position and length showing when the work starts, when it ends, and how long it should take.
In project management, Gantt charts are used to plan task sequences, track dependencies, identify deadlines, and see how delays affect the wider project schedule.
What a Gantt chart actually does when used correctly
At a glance, a Gantt chart looks like a timeline: tasks laid out across dates, neatly organized from start to finish. If that's all you use it for, you're missing its real value.
A well-built Gantt chart helps you decide how work should happen, not just when it happens. That shift changes everything about how useful the chart becomes.
- It turns tasks into a clear sequence. Every project has moving parts. Some tasks can run in parallel, while others need to follow a strict order. A Gantt chart makes those relationships explicit — what happens first, what runs concurrently, and where delays will create knock-on effects.
- It makes dependencies visible and actionable. Dependencies are where most timelines break down. In simple task lists, they're easy to overlook. In a Gantt chart, they're unavoidable — you can see how one task affects another, which tasks control your timeline, and where small delays will have the biggest impact.
- It helps you catch risks early. Most delays aren't surprises. They're built into the plan from the start — tasks packed too tightly, gaps that slow progress, dependencies that create bottlenecks. A visual review surfaces these before work begins.
The key shift is from tracking to decision-making. Most teams update their Gantt chart after work happens, which means it reflects the past rather than shaping the future. The real value comes earlier: deciding sequence, timing, and dependencies while you still have flexibility.
Gantt Chart Starter Kit: Templates, Dependencies, Milestones Setup
Enter your email address to get a comprehensive, step-by-step guide

Why structured project planning matters more than most teams realize
The numbers on project performance make for a sobering read. PMI's Pulse of the Profession research found that fewer than two-thirds of projects meet their goals, and about 17 percent fail outright — with $135 million lost for every $1 billion spent.
The gap between good and bad isn't small
The contrast between high and low performers is stark. PMI's 2018 research identified "Champion organizations" — those completing 80% or more of projects on time, on budget, and to brief — and found a 92 percent success rate versus 32 percent for underperformers.
Structured planning tools like Gantt charts are among the practices that separate the two groups. A poorly built or neglected chart doesn't just produce worse plans — it produces worse decisions across the entire project.
When you actually need a Gantt chart (and when you don't)
Not every project benefits from a Gantt chart. In some cases, it adds friction instead of clarity.
|
Use a Gantt chart when… |
Skip it when… |
|---|---|
|
Your project has multiple phases with clear milestones |
Your work is day-to-day task management |
|
Tasks depend on each other |
Tasks run independently with no sequencing |
|
Fixed deadlines or launch dates anchor the work |
There's no strict deadline driving the work |
|
Several people or teams need to coordinate |
A small team can coordinate in a shared Kanban board |
|
Decisions depend on timing and sequence |
Priority shifts daily and flexibility matters more than structure |
The most common mistake is trying to use one tool for everything. In reality, Gantt charts help you decide how work should be structured, while Kanban boards help you manage how work moves day to day. You need both, for different decisions.

Step-by-step: how to plan a project using a Gantt chart
- Break work into meaningful tasks. Avoid vague tasks like "Work on design." Define specific deliverables: "Create homepage wireframes," "Write email campaign copy." Too detailed and the chart becomes unusable; too vague and the timeline means nothing.
- Define dependencies based on real workflow. Ask what must be completed before something else starts, and what can run in parallel. This step forces the actual order of work.
- Set realistic durations based on capacity. A task that takes two days in isolation might take five in a real schedule. Factor in real capacity tracking: who's responsible and what else they're working on.
- Identify the critical path. Not all tasks affect your deadline. The critical path is the sequence of tasks that determines the project's duration — these are your priority decisions.
- Adjust and optimize before execution. Review for overlapping tasks, wasted gaps, and overloaded team members. Test simple scenarios: what happens if a key task is delayed? Can you shift work to reduce risk? Small changes now prevent major issues later.
Planning is iteration, not perfection. Your first version won't be perfect. In fact, it doesn't need to be. The goal is a structure you can adjust quickly when things shift.
From planning to execution: keeping your Gantt chart alive
Creating a solid plan is half the job. The real challenge is keeping it useful once work begins — and this is where most Gantt charts fail. Updates happen in chats or emails, deadlines shift outside the plan, and teams start working in separate tools. Within days, the chart reflects a reality that no longer exists.
The underlying problem is drift between planning and execution. When the plan lives in one system and the work happens in another, you end up with a plan no one relies on and constant misalignment between teams.
The fix is keeping planning and execution in the same environment:
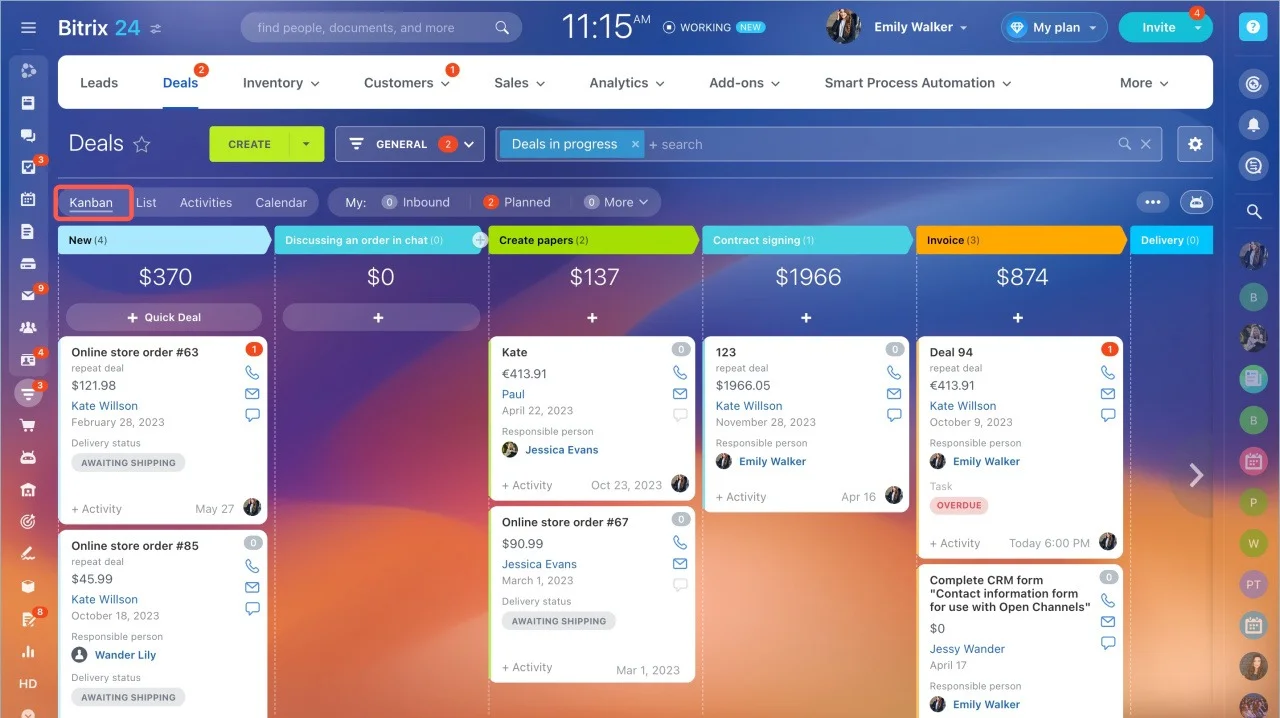
- Kanban boards for daily progress, so tasks move through stages as work happens
- Task management and comments attached directly to the work, keeping conversations and decisions connected
- Automatic updates across views, so when a task changes, deadlines and dependencies update everywhere
When your Gantt chart reflects what's actually happening rather than what was planned weeks ago, it stops being a timeline and becomes a control system.
Using Gantt charts to make better decisions, not just plans
A well-built Gantt chart helps you make faster, clearer decisions as things change.
- Prioritize what actually affects your deadline. Focus on tasks on the critical path, not every open item.
- Respond to delays without losing control. Shift one task and immediately see the impact; adjust dependencies rather than rebuilding the plan.
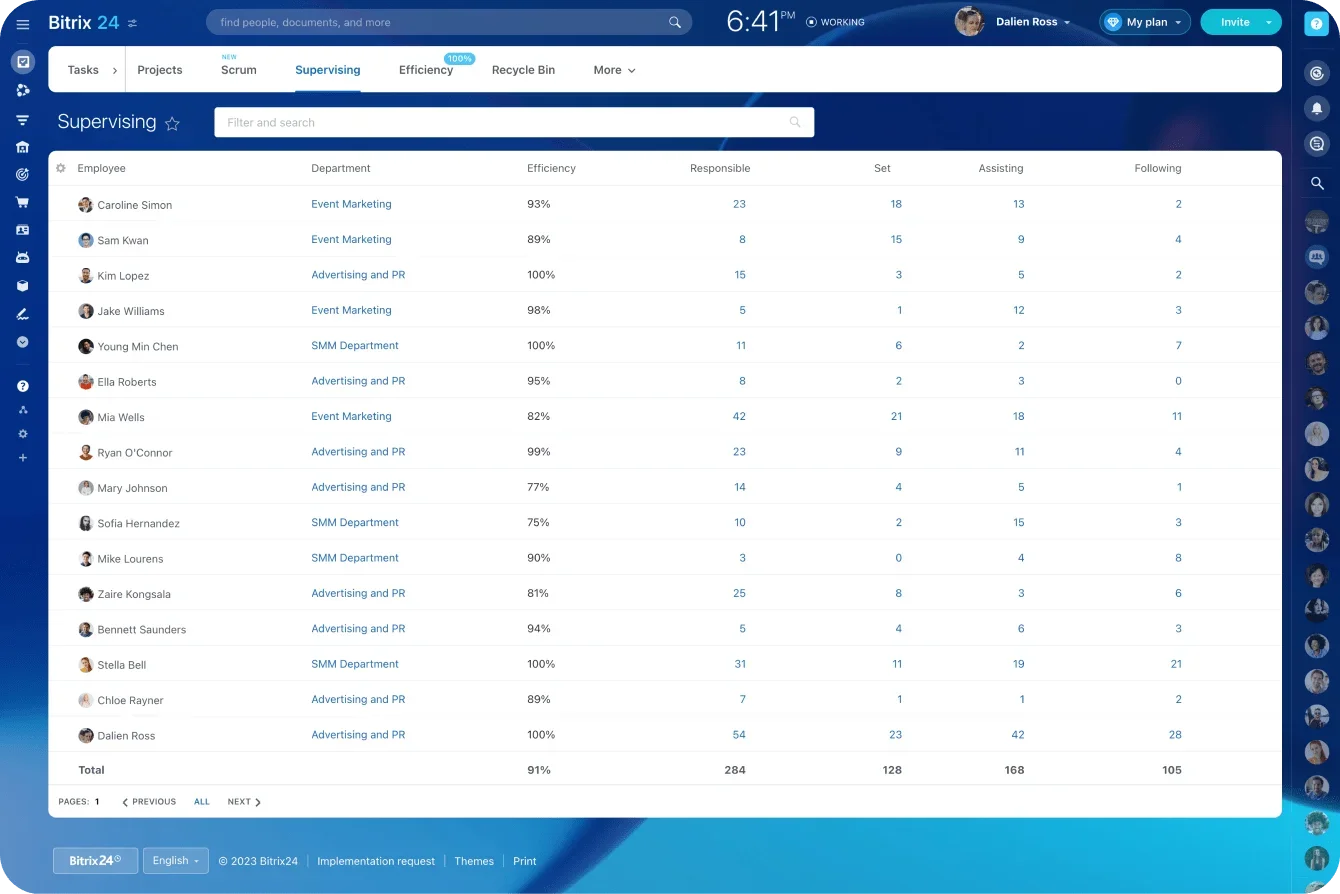
- Make workload decisions before issues appear. When combined with workload visibility, the chart shows whether your plan is realistic given capacity.
- Communicate decisions clearly to stakeholders. A Gantt chart gives you a shared reference. For daily work underneath the plan, pair it with Kanban boards so execution stays visible without cluttering the timeline.
When used properly, the chart changes how you manage projects: from reacting to problems to anticipating them, from guessing priorities to seeing them clearly.
Edge cases most Gantt guides skip
Standard Gantt advice doesn't fit every project. Here's when the defaults shift.
Highly regulated or safety-critical work (construction, pharma, defense). Dependencies aren't advisory; they're enforced by regulation or physical reality. Build in buffer aggressively, maintain change logs alongside the chart, and expect stakeholder sign-offs at every milestone. The chart becomes a deliverable, not just a planning tool.
Cross-functional projects spanning departments with different cadences. Engineering runs in 2-week sprints; marketing runs in quarterly campaigns; finance runs monthly. Force-fitting all three into one Gantt chart creates noise. Use the Gantt at the integration level (just the milestones where teams hand off to each other) and let each team use their own native cadence underneath.
Remote or distributed teams across time zones. Gantt accuracy depends on updates. If team members don't share working hours, stale data compounds faster than in co-located teams. Pair the chart with strong remote-work communication and collaboration for each task, and require dependency holders to flag delays within 24 hours.
Highly uncertain or research-heavy projects. Gantt charts assume you know what the tasks are. Early-stage research, product discovery, and exploratory work violate that assumption. Use a rolling Gantt — detailed for the next 4 weeks, high-level for everything beyond — and update the detail horizon weekly.
Fixed-deadline, flexible-scope projects (events, product launches, regulatory filings). You can't move the date, so scope becomes the variable. Build the Gantt backward from the deadline and identify which tasks are must-have versus nice-to-have. When slippage happens, cut scope, not dates.
Portfolio-level planning across multiple simultaneous projects. A single Gantt chart breaks down when you're running 10+ projects. Use summary-level "hot air balloon" views — milestones only — for portfolio oversight, and detailed Gantt charts at the individual project level. The two views serve different decisions and shouldn't be merged.
Very small teams (1–3 people). The overhead of maintaining a Gantt chart often outweighs the benefit. A simple task list with due dates and a weekly review does the same work with less friction. Adopt a Gantt chart when you hit 4+ team members or 3+ simultaneous projects.
Common mistakes that break Gantt-based planning
|
Mistake |
How to fix it |
|---|---|
|
Overcomplicating the chart with every small task |
Focus on meaningful deliverables; group smaller actions under larger tasks |
|
Ignoring dependencies so tasks appear on track but the sequence is broken |
Define dependencies from the start; review and update as the plan evolves |
|
Using the Gantt chart only for reporting after work happens |
Use it before execution to design the plan, update as decisions are made |
|
Disconnecting planning from execution across separate tools |
Keep planning, tasks, and communication in the same system |
|
Setting unrealistic timelines based on best-case scenarios |
Base timelines on real capacity and use a Gantt chart with dependency tracking to surface overloaded assignments early |
Best practices for smarter Gantt chart planning
- Keep tasks outcome-focused. Define work in terms of deliverables, not activities.
- Review dependencies regularly. Small sequence changes can shift your timeline significantly.
- Use Gantt for structure and Kanban for flow. Plan how work should happen, then manage how it moves.
- Balance workload early. Capacity decisions belong before execution, not after delays appear.
- Keep communication inside tasks. Decisions, updates, and context belong attached to the work itself.
Good planning doesn't need to be complex. It needs to be clear enough to support fast, confident decisions.
From timeline to control system
A Gantt chart can be a simple timeline, or it can be the system that helps you run your project with confidence. When you treat it as a decision-making tool, you start to see how work actually fits together, what drives your deadlines, and where risks are building before they become problems.
The catch is that a plan disconnected from execution goes stale fast.
That's the gap Bitrix24 closes: Gantt charts, Kanban boards, workload visibility, and task-level communication in one place, so the plan your team builds is the same one they're working from.
Start free and see if it changes how your projects run.
Harness the Power of Gantt Charts
Unleash the full potential of project planning with Bitrix24's integrated Gantt charts, Kanban boards and task management. Boost efficiency and make smarter decisions today.
Start NowFrequently asked questions
What alternatives to Gantt charts does Bitrix24 offer?
Bitrix24 supports Kanban boards, task lists, calendars, workload views, Scrum-style planning, and classic Gantt charts when timelines still matter.
Can teams switch between views without recreating tasks?
Yes. The same work can be viewed in different formats, which helps teams plan by deadline, workflow, or owner without duplicate records.
When is a non-Gantt view the better choice?
Choose it when speed, changing priorities, and work-in-progress limits matter more than long dependency chains.
How do you know the new planning view is working?
Track cycle time, overdue rate, blocked tasks, workload balance, and the time it takes to move work from idea to completion.