Sales Pipeline Management: Forecast Clearly Without Chasing Updates
Your deals live in too many places — spreadsheets, inboxes, call notes, chat — and every pipeline review turns into detective work. You ask, “Which opportunities will close this week? Which stalled last Tuesday?” but answers arrive late, partial, or contradictory. Without a clear, shared view, you manage by feel instead of facts.
The cost is real. Stalled deals quietly roll into next month. Forecasts miss by wide margins because probabilities and close dates go stale. Managers spend hours pinging reps for status, while reps re-enter the same updates across tools. Competitors who see risk sooner and respond faster take the deal.
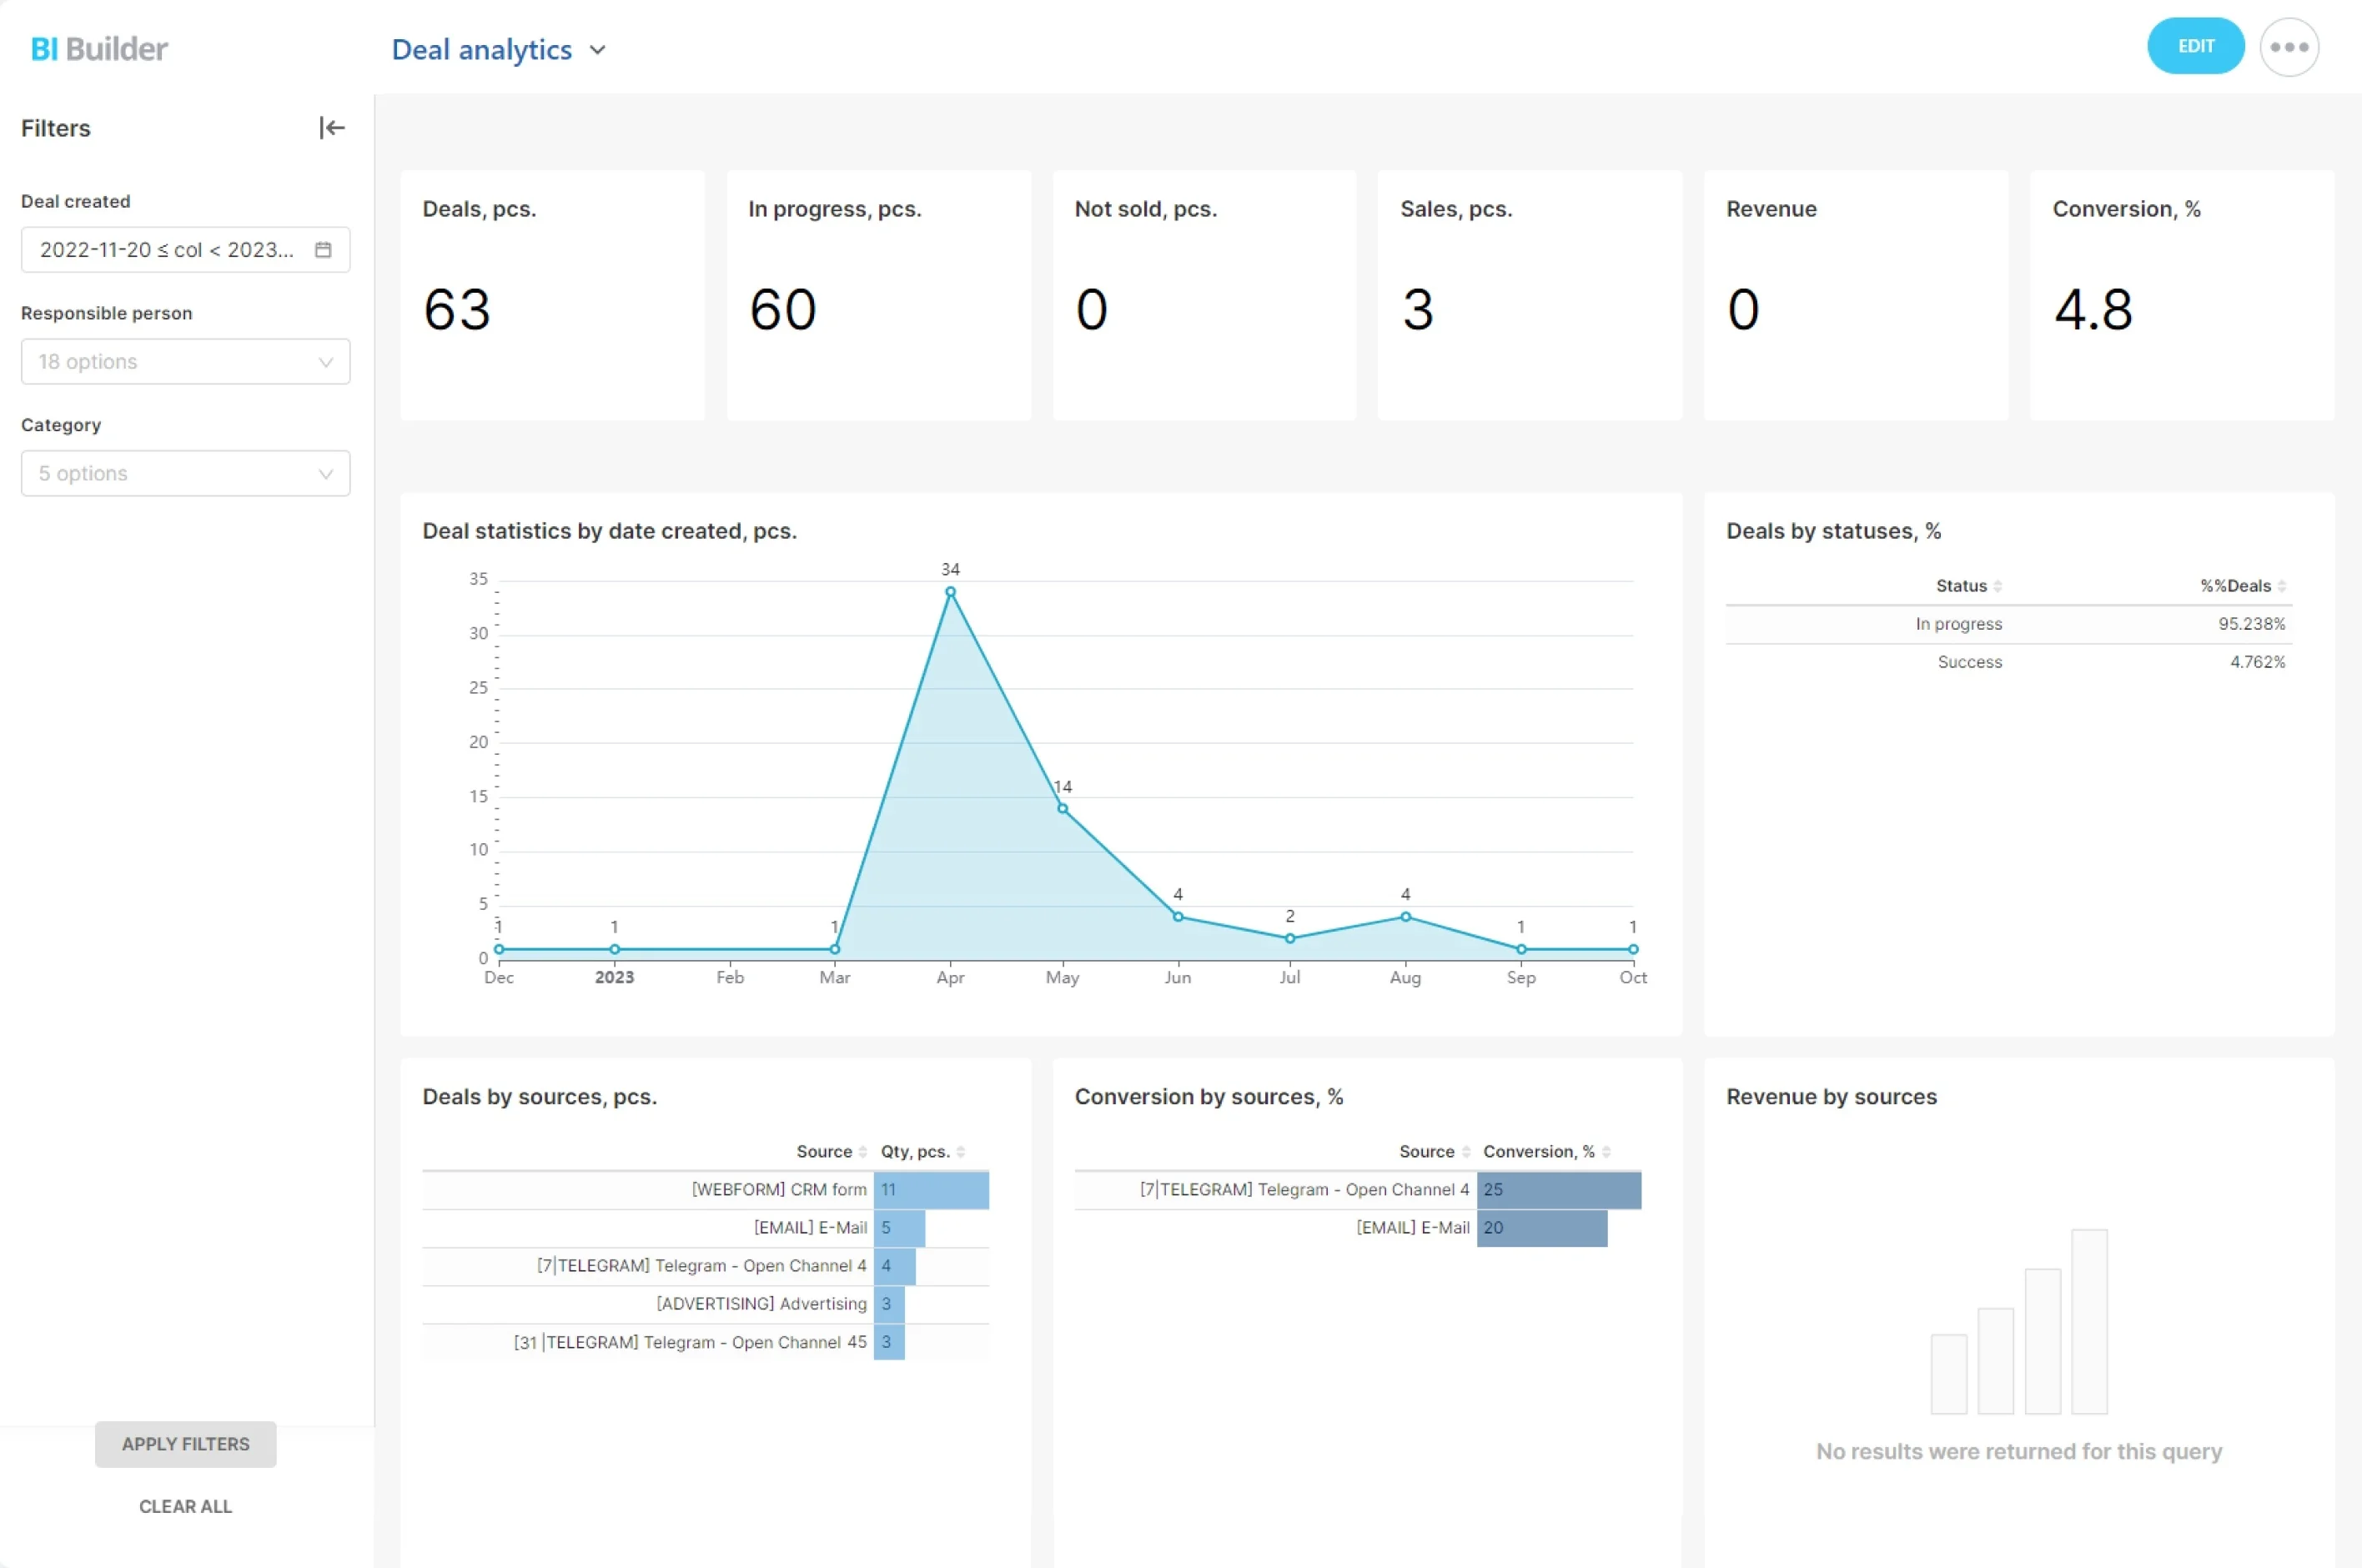
Bitrix24 replaces uncertainty with clarity. Your entire sales process becomes a visual, drag-and-drop Kanban CRM — so you can spot hot deals, stalled opportunities, and forecasted revenue in seconds. Cards show amount, probability, next step, owner, and expected close; badges flag overdue activities and idle time. One board, one truth.
See it in action right now: launch the interactive demo in your browser or watch a 20-second animated GIF of a deal moving from First Contact to Won, with automatic tasks, emails, and approvals at each step. No guesswork — just a pipeline you can trust.
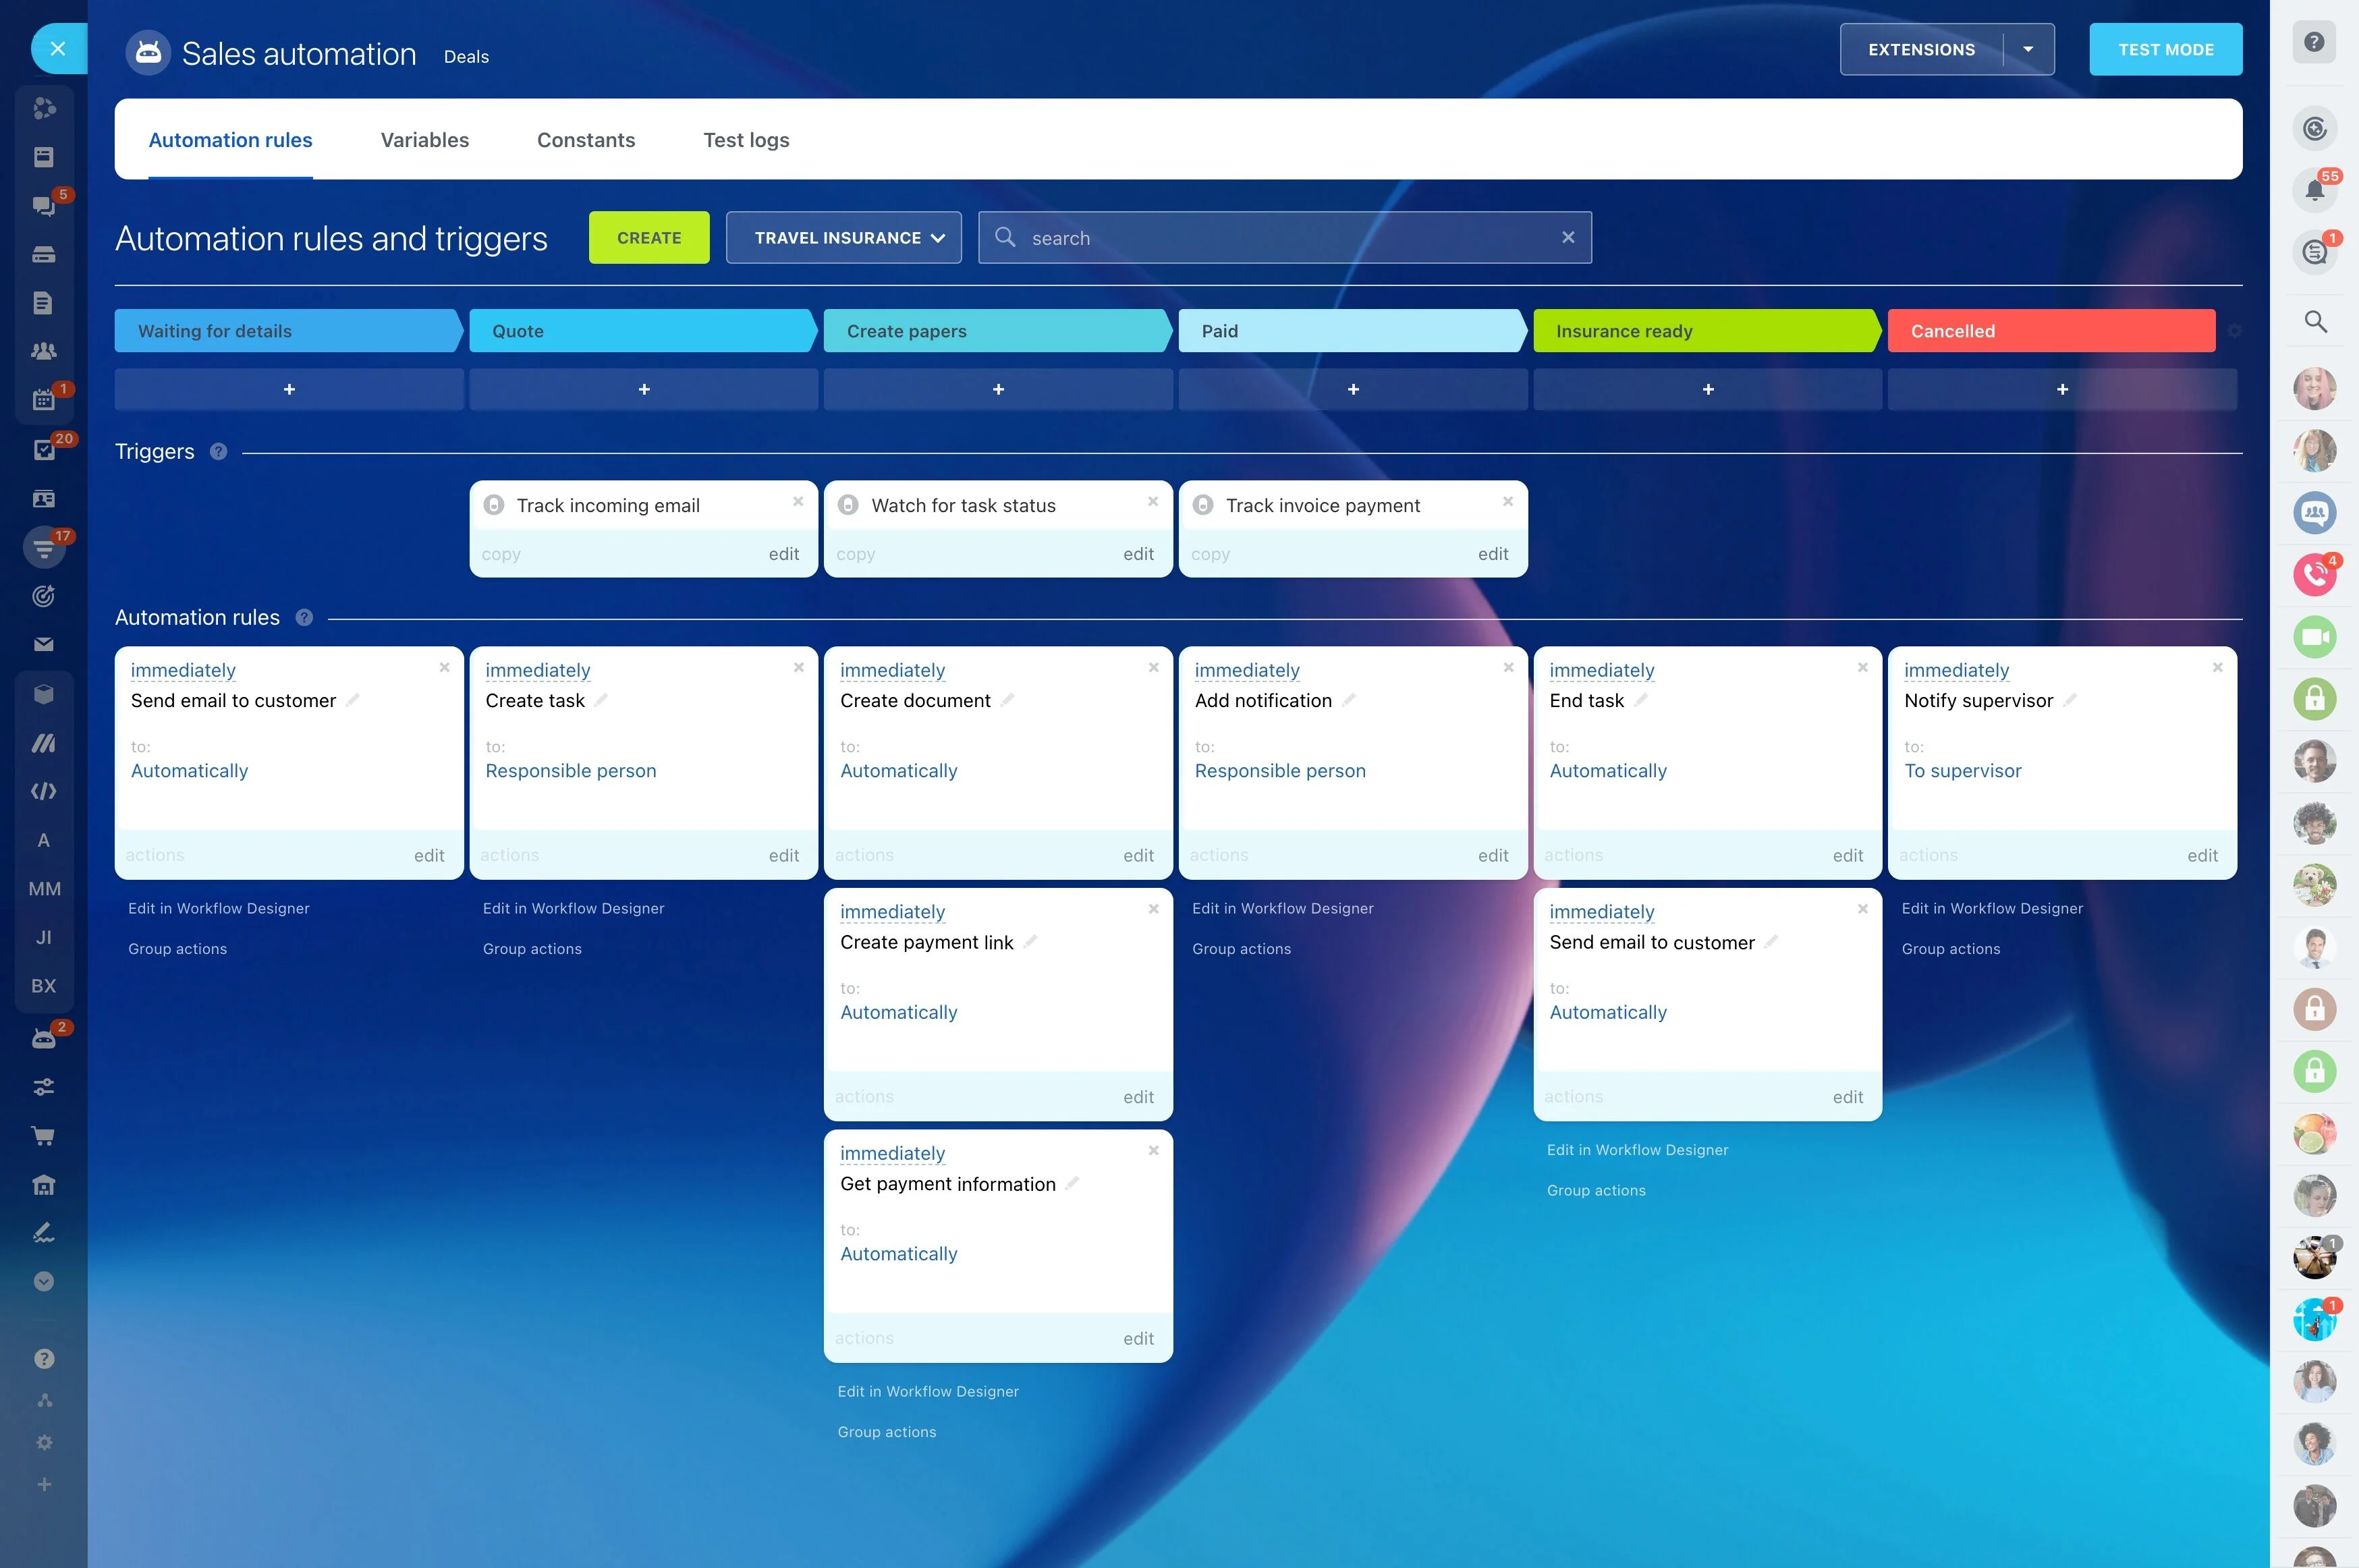
Automate follow‑ups and handoffs, not just reports
Reports don’t close deals — consistent follow‑through does.
Design your process once, then let it run:
- On stage change, auto‑send a personalized email, schedule a call, or assign a task with a due date and checklist.
- Generate a quote or proposal from a template, pull accurate pricing from your product catalog, and attach it to the deal timeline in one step.
- If a deal amount crosses a threshold, request manager approval and pause progression until approved; notify the rep and manager in chat.
- Auto‑create subtasks for legal, finance, or onboarding when a deal hits Contract Sent or Won; include owners, SLAs, and dependencies so nothing slips.
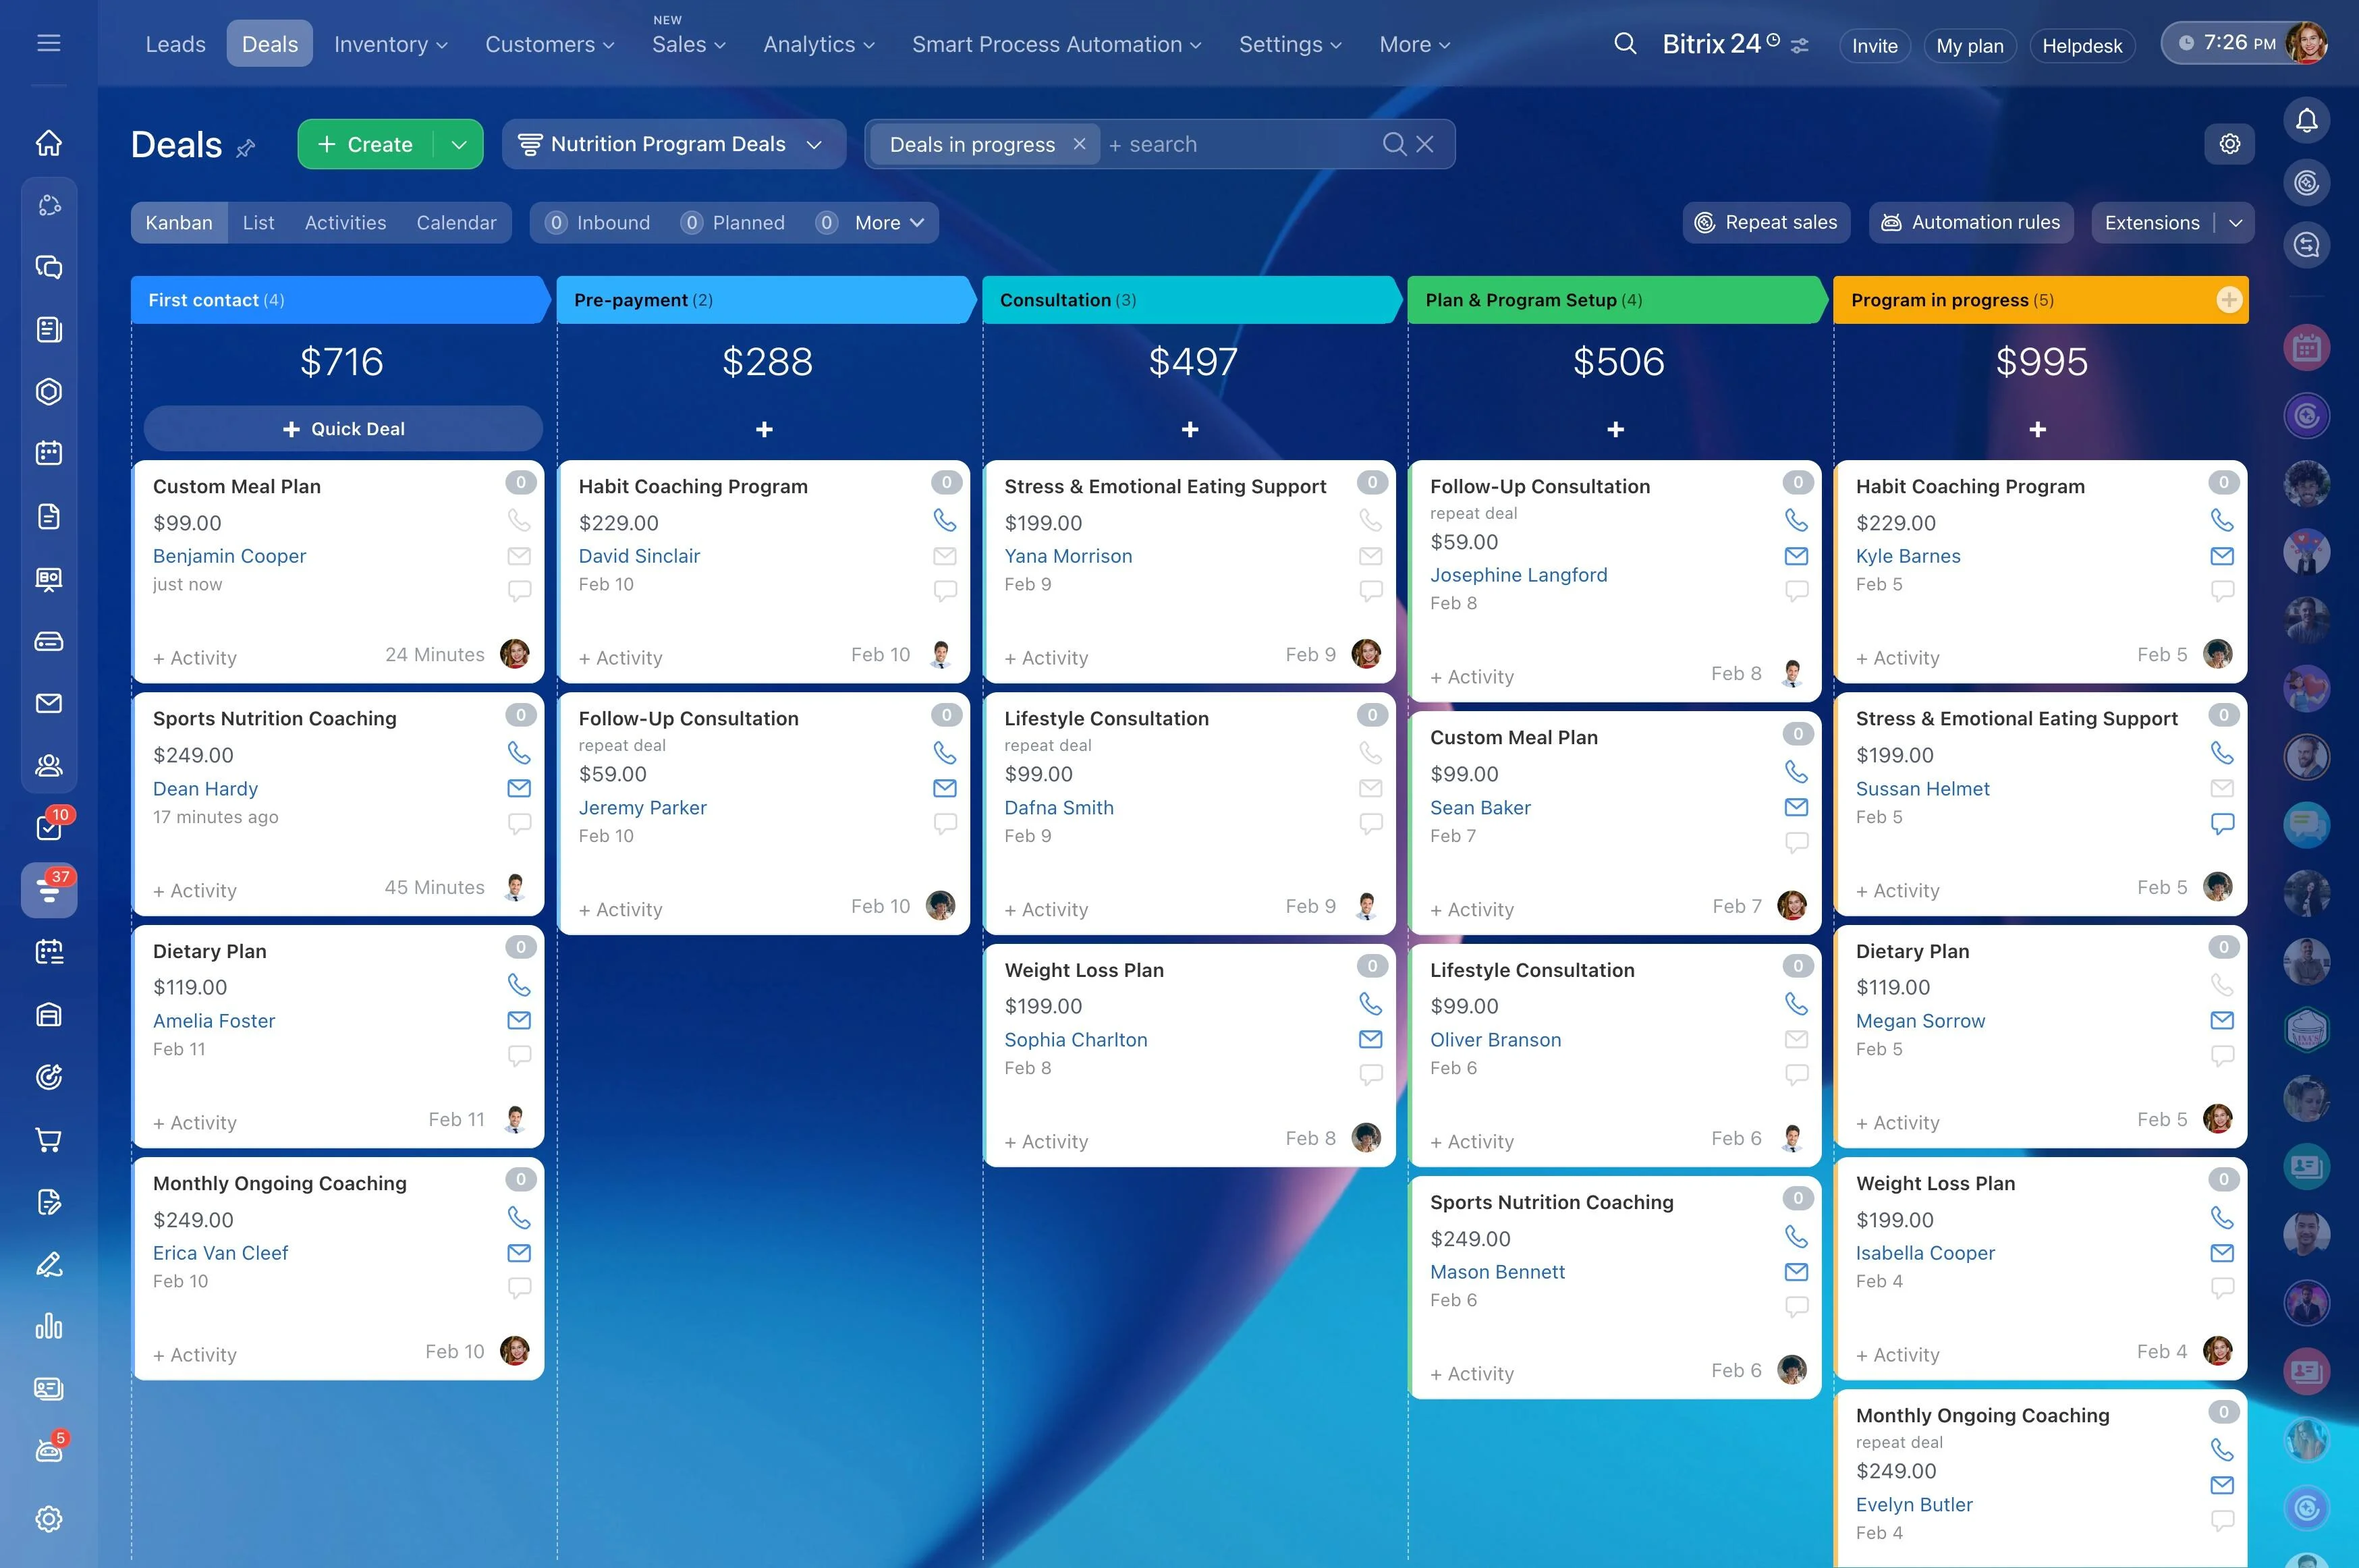
Turn guesswork into a visual Kanban CRM
When your pipeline is buried in rows and tabs, you find problems after they hurt the number.
The problem you’re solving: spreadsheets hide context and lie by omission.
- Each deal card shows company, amount, probability, expected close date, owner, and the next scheduled activity.
- Visual badges highlight risk: overdue follow‑ups, idle time in stage, missing decision maker, or no next step.
- Inline edits and drag‑and‑drop updates replace forms and clicks. Move a deal, adjust the close date, add a note — right on the card.
- Filters for owner, amount range, close date window, source, product, or segment help managers and reps each get the view they need; save and share views so everyone speaks the same…
Find stalled deals before they go cold
Stalls rarely arrive as “We’re not interested.” They hide in “Circle back next week” and unreturned emails.
Automation turns vigilance into muscle memory:
- Inactivity counters show how many days since the last call, email, or meeting; stage‑time indicators reveal how long a deal has sat in the same column.
- Overdue badges flag missed promises — like a follow‑up that should have happened yesterday.
- Smart filters isolate “no next step scheduled,” “stuck over 7 days,” or “closing this week with no meeting” — so managers can triage fast.
- One click adds the next activity (call, email, meeting), assigns the owner, sets the due date, and logs to the timeline.
Forecast revenue you can defend
If your forecast depends on last‑minute gut checks, you’re flying blind.
With/without comparison:
- Each deal includes amount, currency, probability, and expected close date; totals roll up by owner, team, stage, and pipeline. When a rep moves a card, the forecast refreshes instantly.
- Weighted pipeline views show best case, most likely, and committed numbers for any date range. Compare this week to last to see momentum, not just snapshots.
- Sales plan and quota tracking let you set monthly or quarterly targets per rep and team; progress bars show attainment, pace, and the shortfall you still need to close.
- Funnel and stage conversion reports expose leaks: too many deals dying in Qualification? Long delays in Legal? Fix the one step causing most of the miss.

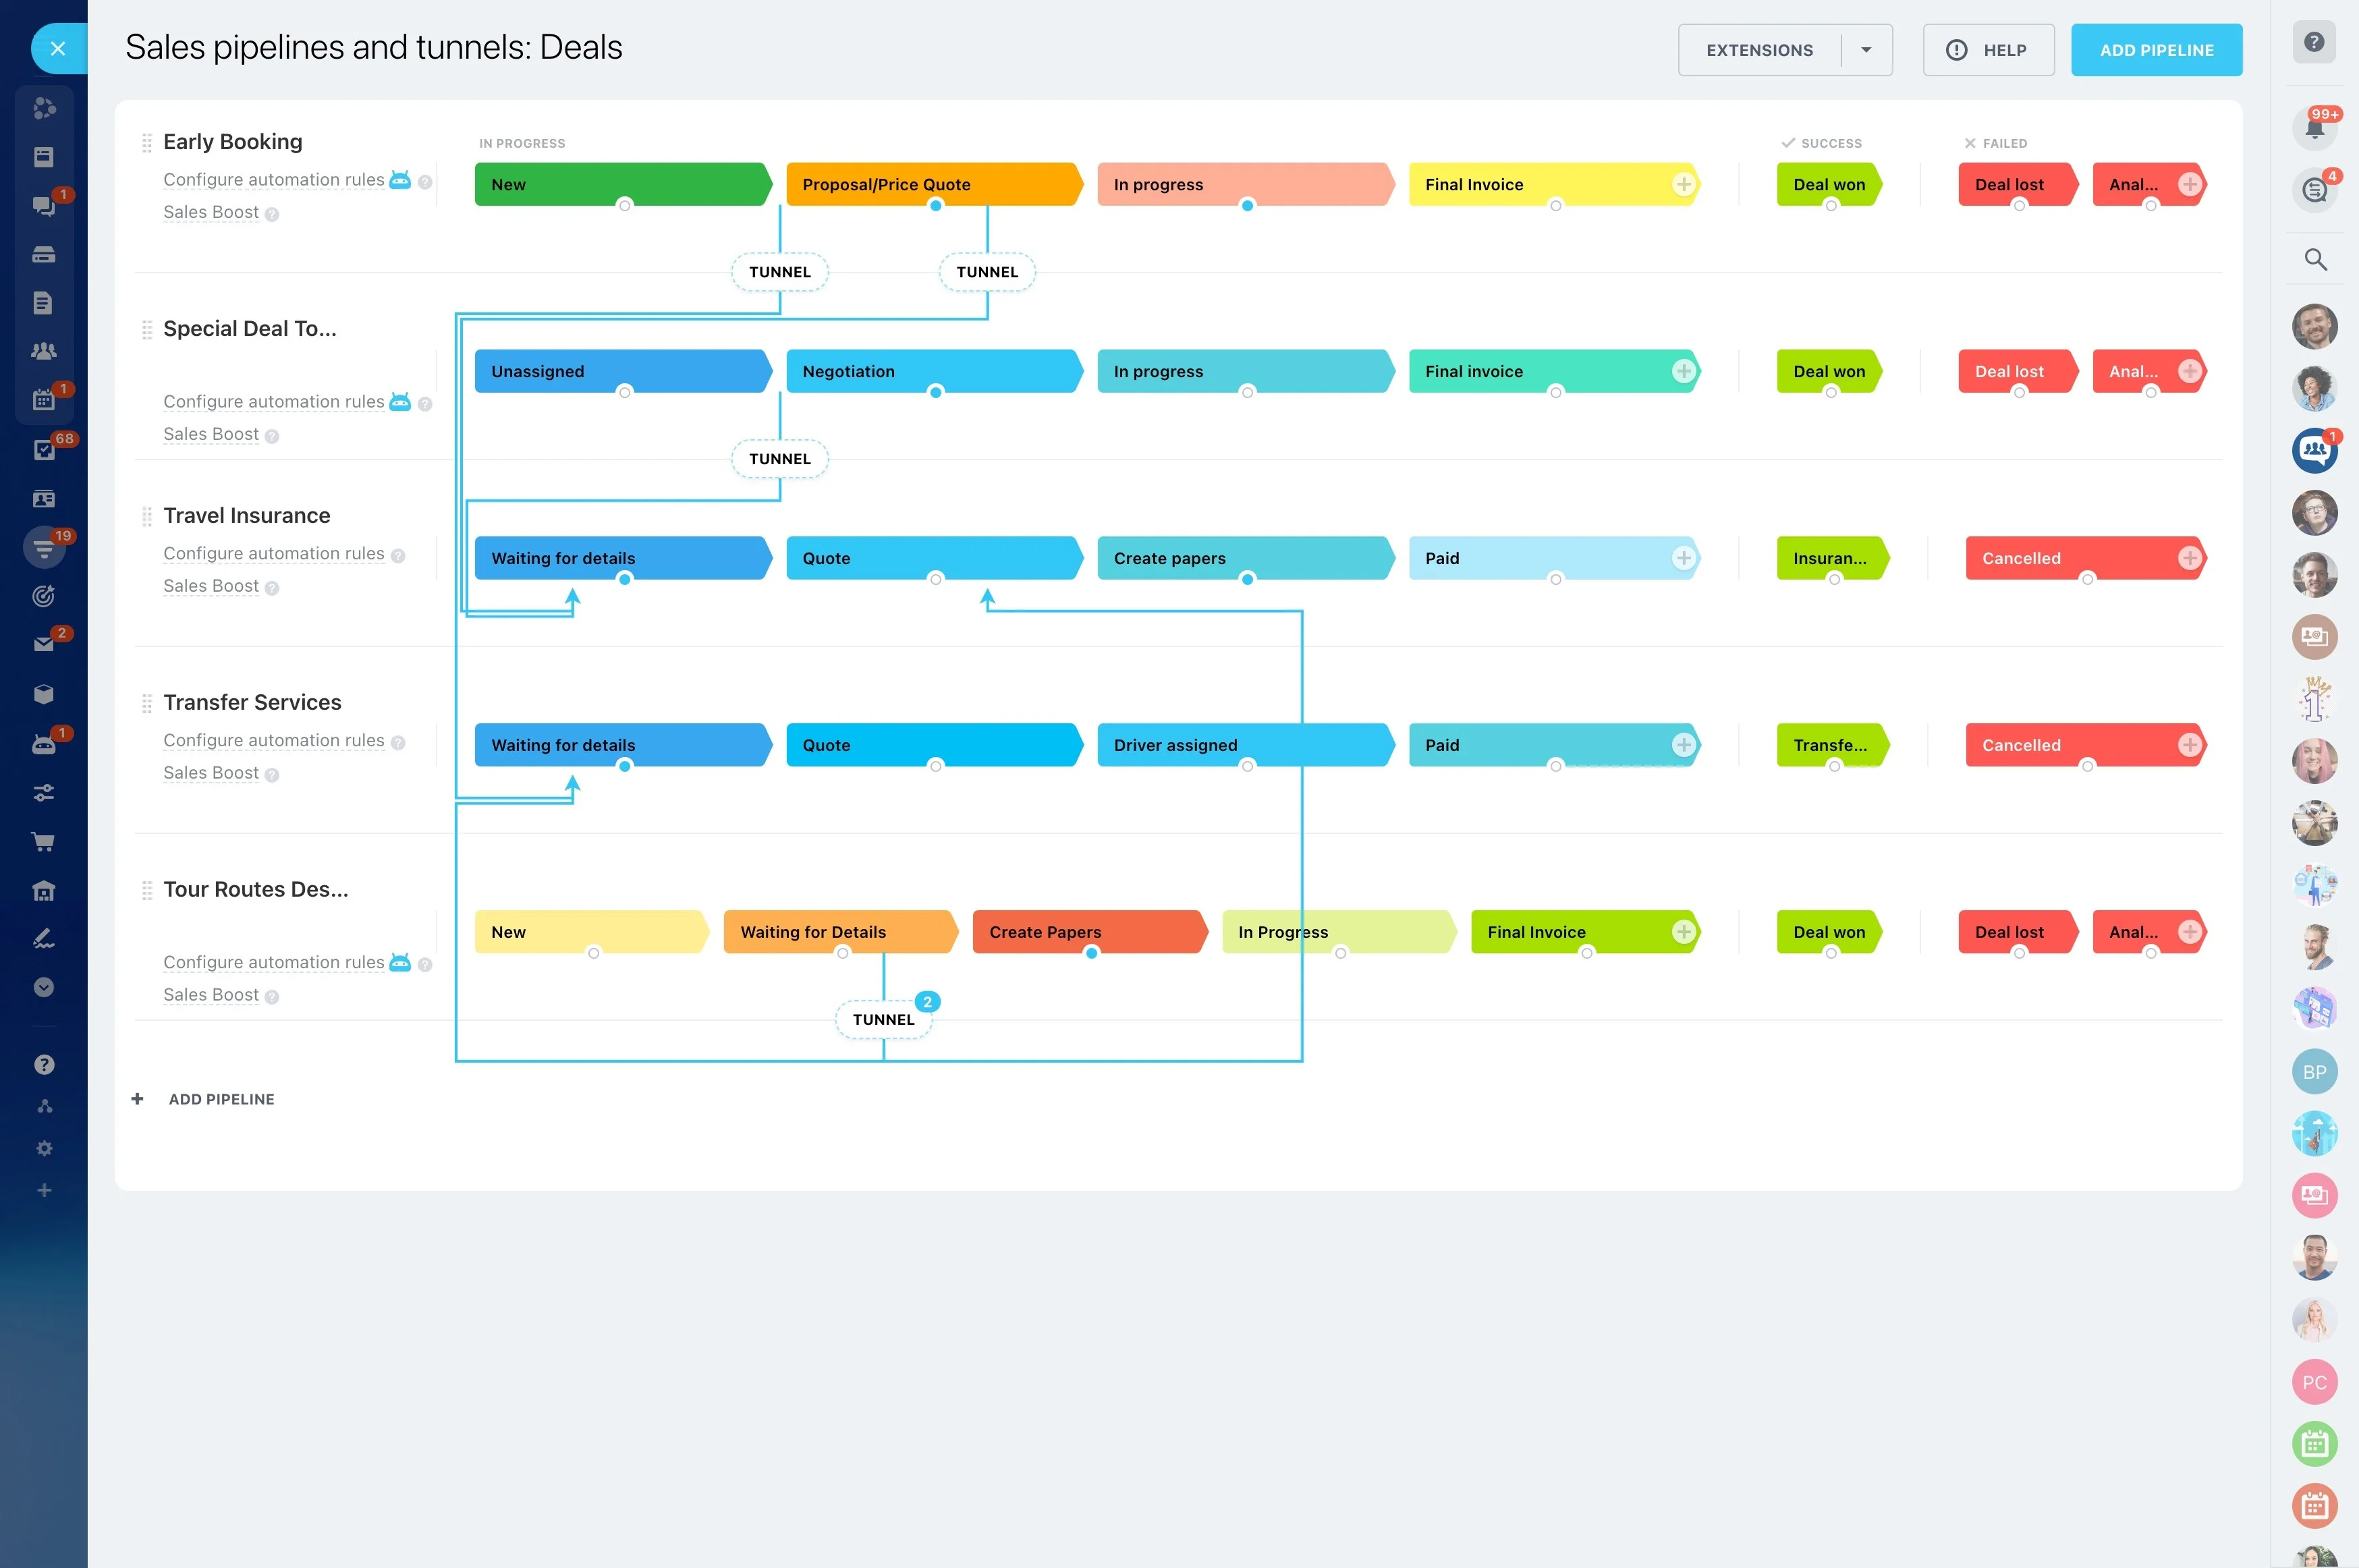
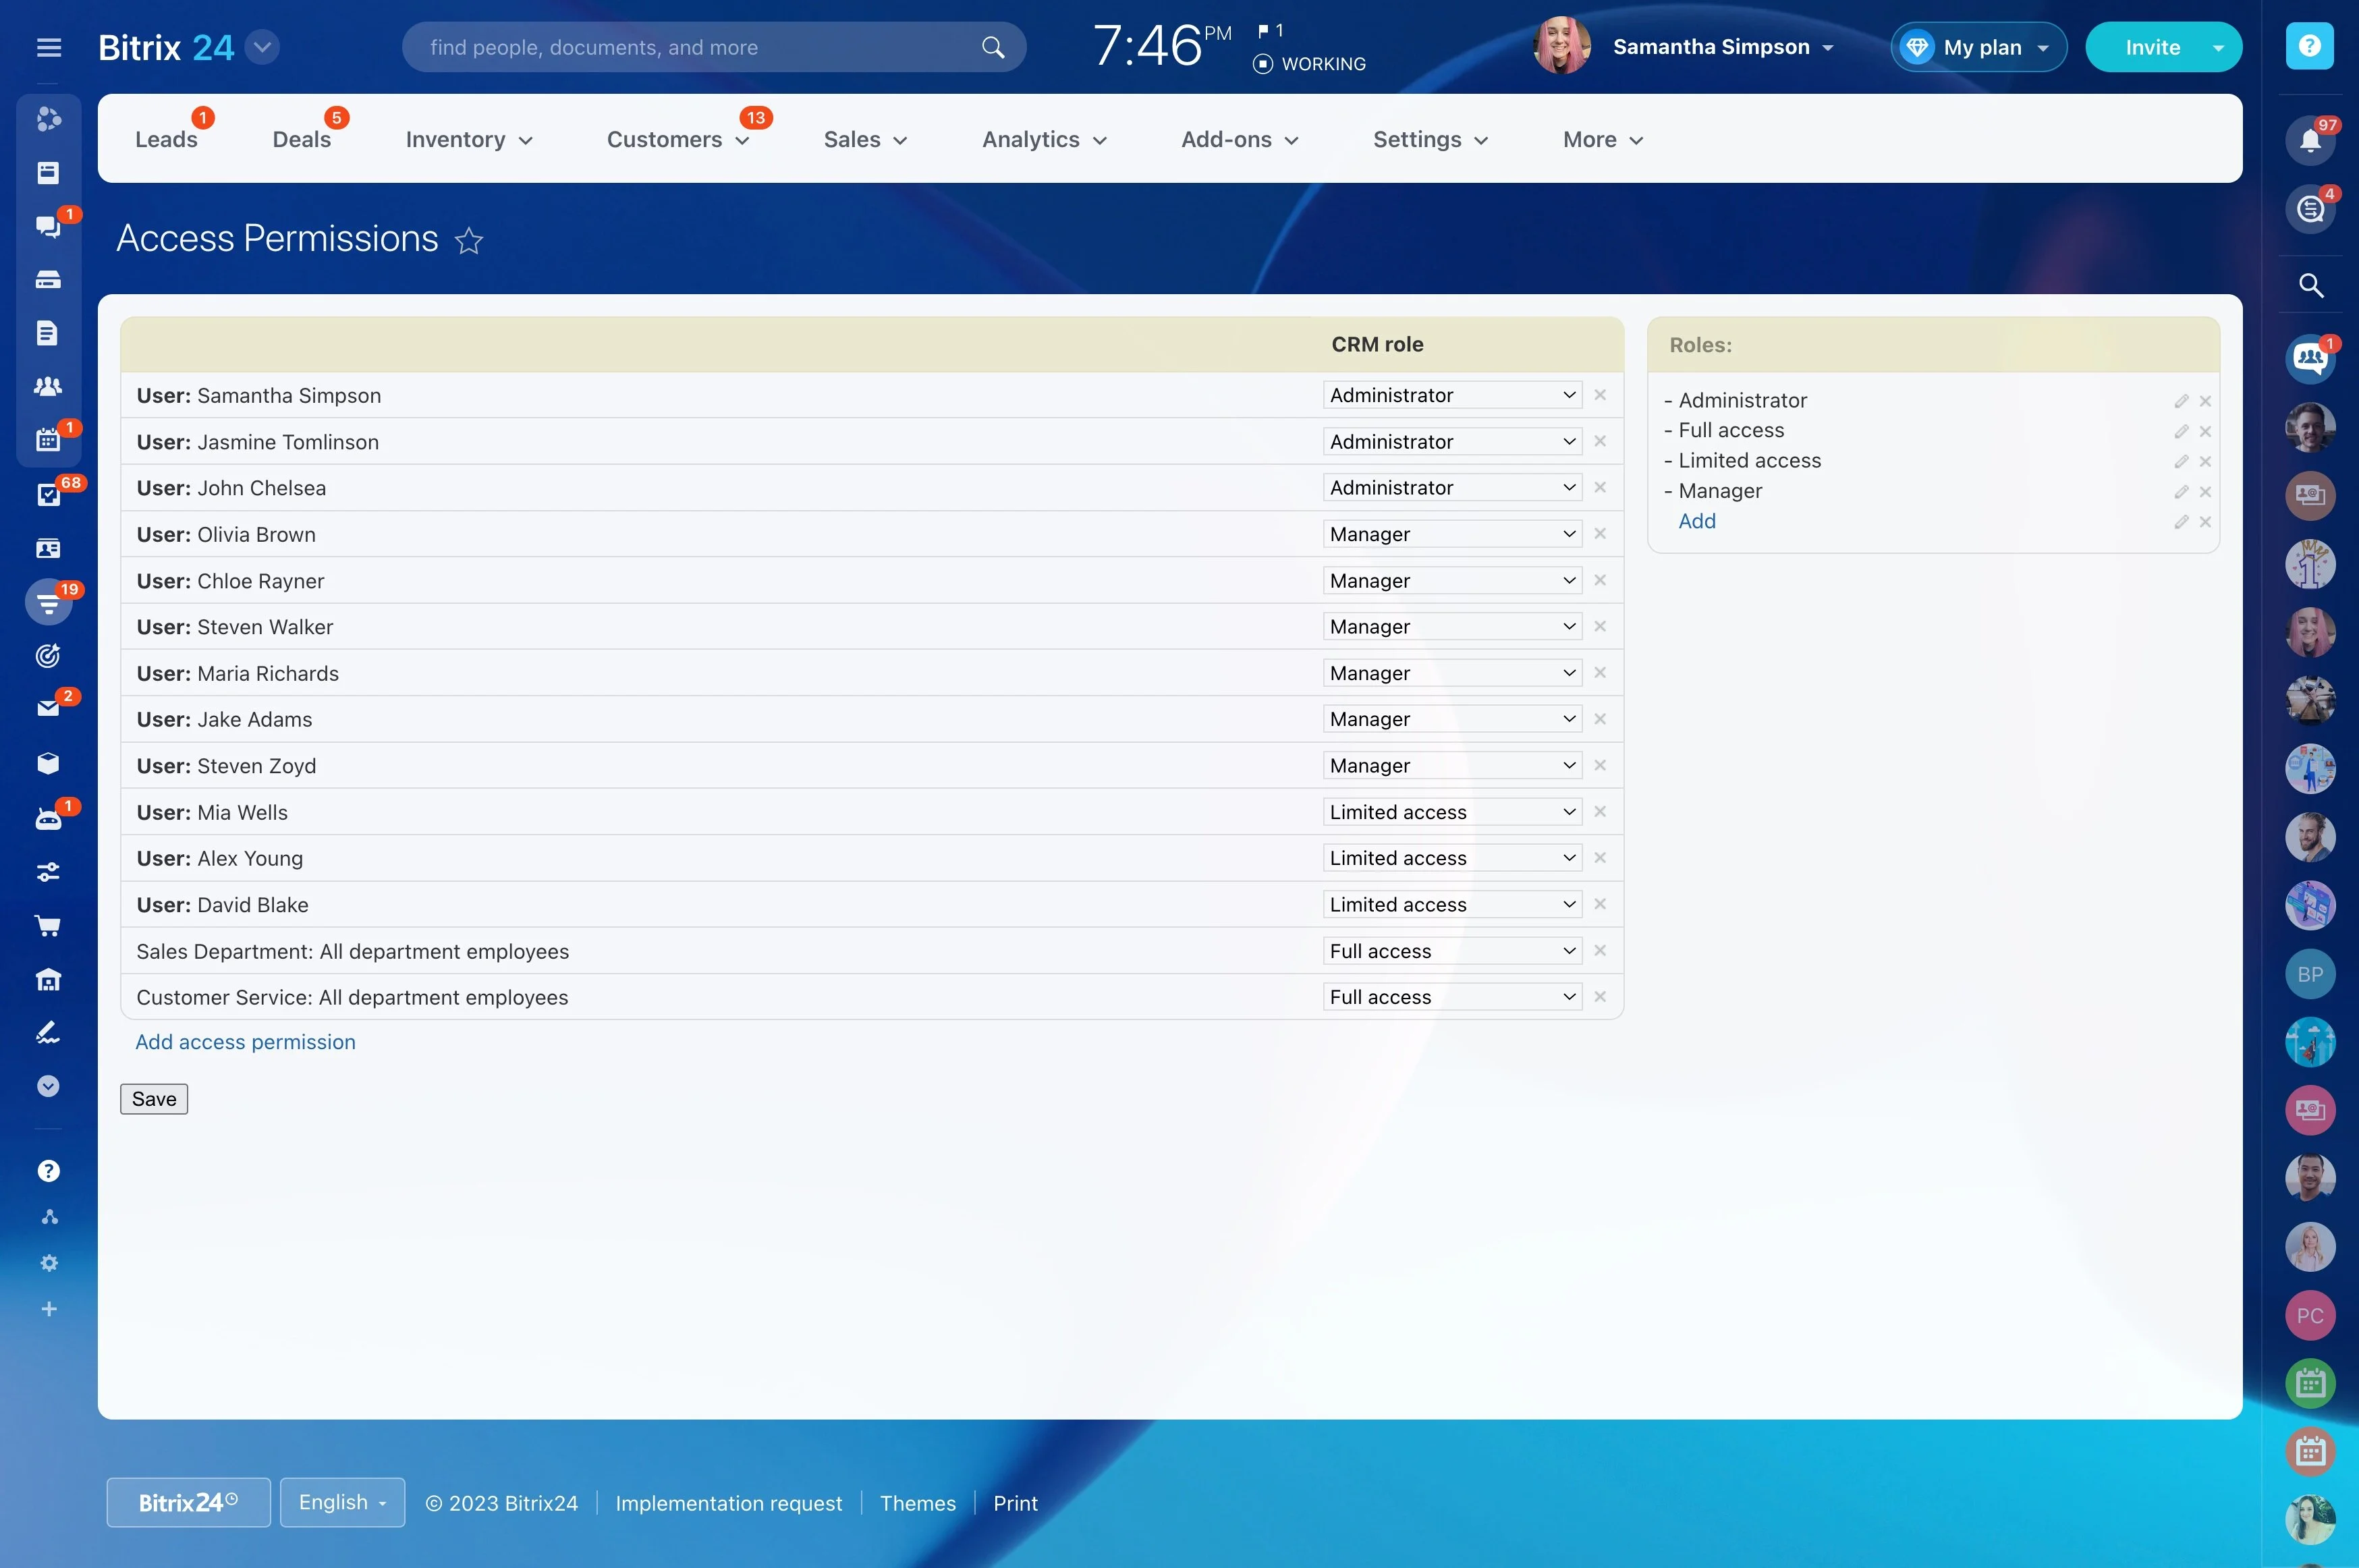
Built for your process: multiple pipelines, custom fields, clear permissions
Your business isn’t one‑size‑fits‑all.
Make the CRM fit your motion:
- Create multiple pipelines (new business, renewals, channel, enterprise) with unique stages, automations, and exit criteria.
- Add custom fields, products, and price lists; set required fields by stage (e.g., Decision Maker and Budget before Proposal) to protect data quality.
- Define clear roles and permissions so managers see everything, reps see only their accounts, and partners or contractors see just their deals.
- Use checklists and templates to guide consistent discovery, qualification, and proposal steps; attach scripts, battlecards, or legal notes to stages.
Prove what works. Fix what doesn’t.
Good decisions need more than a hunch about “momentum.” Bitrix24 ties activity, conversion, and revenue together so you can coach with evidence, invest where it pays, and cut what doesn’t.
The cost of not measuring: scattered reports, conflicting numbers, and debates you can’t resolve.
- Funnel analytics by source, segment, owner, and pipeline: where leads convert and where they die. Compare month‑over‑month to spot trends early.
- Time‑in‑stage metrics that reveal true bottlenecks (Qualification taking 6 days vs. a 2‑day target? Now you know where to intervene.)
- Win/loss breakdowns with required reasons and competitor fields at Closed Won/Lost; filter by rep or product to spot patterns.
- Activity‑to‑outcome correlations — e.g., deals with a scheduled next step within 24 hours win significantly more often in your data. Use that to set team standards.
