Sales Reporting and Analytics: Real-Time Numbers Without Manual Reports

Every week, you rebuild the same sales report in Excel — copying columns from your CRM, fixing broken formulas, and answering last-minute pings for “the latest numbers.” You’re hunting for the right tab, reconciling filters, and explaining why totals don’t match what the team sees in the pipeline. It’s slow, it’s fragile, and it steals time from selling.
The cost is bigger than a few tedious hours. Manual spreadsheets create blind spots and lag. While you’re cleaning cells, opportunities quietly stall, forecasts age out, and managers make decisions on stale data. That delay shows up as longer sales cycles, missed coaching moments, and end-of-quarter surprises.
The hidden costs add up fast:
- Lost time: 3 — 6 hours per week rebuilding the same views and pivots
- Errors and rework: broken formulas, misapplied filters, version conflicts
- Decision lag: managers wait for a snapshot instead of acting on live data
- Misalignment: different teams calculate KPIs differently, causing disputes
- Opportunity risk: stalled deals and aging stages go unnoticed until it’s too late
Bitrix24 replaces manual spreadsheets with live, automated sales reporting. Your CRM dashboard always reflects what’s happening right now — no copy/paste, no rebuilds. Build, share, and schedule manager-ready CRM analytics in minutes. You keep selling; Bitrix24 keeps your numbers current, consistent, and actionable.
See the future with pipeline-based forecasts you can trust.
Forecasts shouldn’t be wishful thinking or spreadsheet gymnastics.
Go deeper with pipeline hygiene: visual funnel leakage, stage aging, and commit categories sit next to your forecast so you can separate healthy coverage from noise.
- Weighted revenue by stage: probability‑adjusted totals update as deals move, instantly reflecting pipeline changes.
- Scenario toggles: include/exclude late‑stage risks, specific sources, or segments; run conservative vs. upside scenarios in seconds.
- Roll‑ups you can trust: individual, team, and region forecasts aggregate automatically with drill‑downs to the exact deals.
- Trend lines: compare your current quarter’s trajectory to the last two, spot slippage early, and adjust coverage before it hurts.

One CRM dashboard. Zero spreadsheet chaos.
Spreadsheets are fine for finance snapshots.
The fallout is familiar: one tab uses a different close date than another; a filter misfires and hides a rep’s deals; a SUMIF breaks and the total quietly drops.
- Pipeline health by stage with stage aging and stalled deals highlighted
- Revenue by source, product, territory, owner, or any custom field
- Win/loss trends, conversion rates, and average deal size over time
- Team activities: calls, emails, meetings, and follow‑ups, tied to outcomes

Build any report in minutes—not Mondays.
Your manager asks, “Can I get revenue by source versus quota for the past 8 weeks, split by region?” That shouldn’t cost you a weekend.
Popular reports you can create fast:
- Drag charts, tables, funnels, and KPI tiles onto the dashboard. Choose fields from deals, contacts, products, or activities.
- Segment by owner, region, product, or source with a few clicks. Stack by week or month. Add totals, averages, and probability‑weighted revenue.
- Save the layout as a dashboard, name the filters (“Last 8 Weeks | EMEA | New Business”), and share it with your team. Next time the question comes up, just open the saved view.
- Pipeline velocity: time in stage, conversion per step, bottlenecks by team

Real-time analytics that drive action, not hindsight.
Move from lag to lead indicators:
The cost of not acting is real.
- Live thresholds and alerts: flag deals that exceed normal stage aging or lack a next step; spotlight high‑value opportunities going quiet.
- Goal tracking: monitor individual and team targets with real‑time attainment and pace, so you can course‑correct mid‑month.
- Instant drill‑downs: click any chart to open the deals or activities behind it, filter them, assign tasks, or send a message — right from the view.
- Segmentation on demand: compare results by source, product, region, industry, or owner; save the slice for next time.

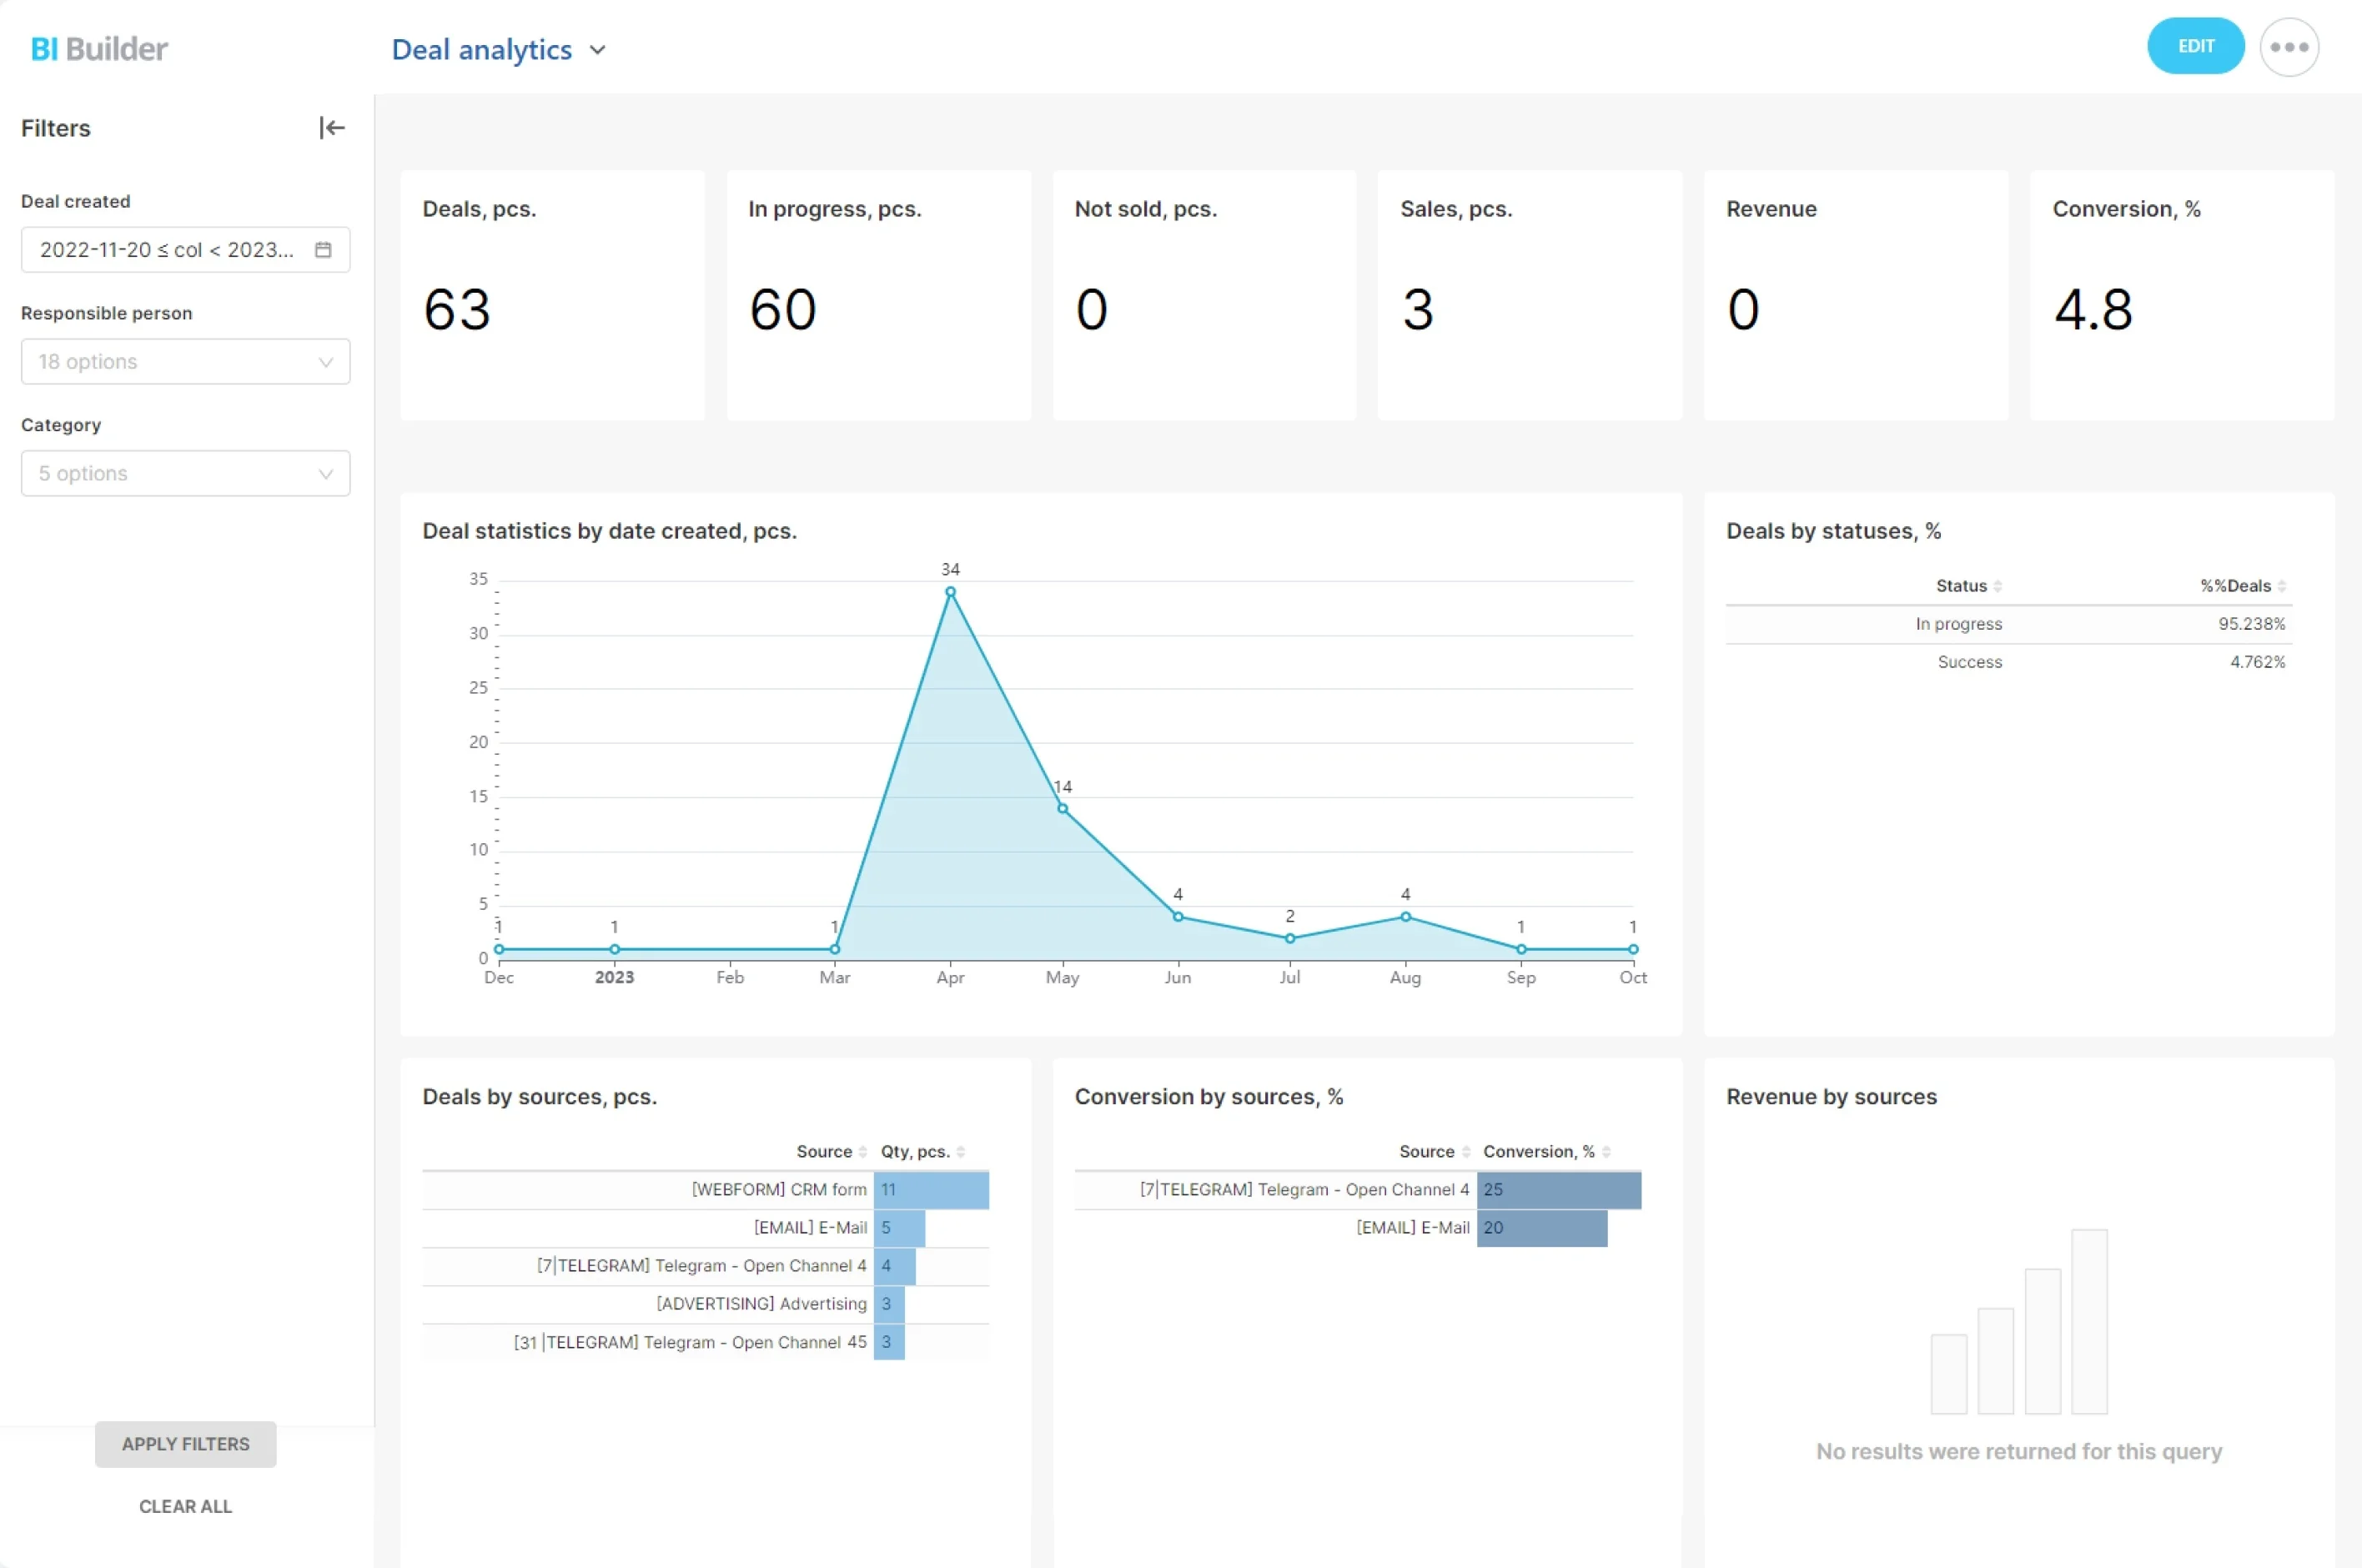
Sample sales dashboard: what your manager sees.
Use it as a starting point, then tailor it to your process, fields, and targets.
Screenshot to include:
- File: /assets/bitrix24-sales-dashboard-sample.png
- Alt text: “Bitrix24 Sales Dashboard — Current Quarter overview with live KPIs, funnel, forecast, sources, leaderboard, and alerts.”
- Recommended size: 1600×900 for clarity on desktop
- Title: Sales Overview — Current Quarter

Fast rollout. Flexible for any team.
You don’t have to rebuild your world to modernize reporting.
Getting started is simple:
- Import your current data from CSV/Excel with guided field mapping. Bring deals, contacts, companies, products, activities, and custom fields.
- Mirror your pipeline: stages, sources, products, territories, and probability settings align with your existing process.
- Pick a dashboard template (Manager Overview, Rep Scorecard, Forecast) and tailor it to your KPIs.
- Invite your team and set role‑based permissions for views, sharing, and edits. Managers see roll‑ups; reps see only their own deals.